News
 
Gravatar

Have you ever wondered how leading companies stay ahead of the curve and continuously meet their strategic goals? What if you could see every facet of your business in real time and pivot instantly when needed? Imagine having a single metric that aligns every department, focuses all efforts, and acts as the compass guiding your business toward success. How powerful would that be for your organization?

Consider the case of Dolls Kill, an eCommerce and retail fashion company renowned for empowering women to express their unique styles. With a mission to "unleash their inner 'whatever,'" Dolls Kill turned to Grow’s dynamic KPI dashboards for a comprehensive, live view of their operational data. This wasn't just about accessing information; it was about transforming how they do business. 

According to Jon Dussel, CFO of Dolls Kill, and Sofia Archuleta, Business Ops Analyst, 

the real magic came from how Grow’s tools allowed them to monitor every aspect of their operation—from sales and customer service to product margins and shipping times—all in real-time.

Companies that use real-time data can outperform their competitors in terms of financial performance. But it’s not just about the numbers; it’s about how teams use this data to drive decisions. At Dolls Kill, team members continuously adjust their focus based on live updates, ensuring they meet targets and adapt swiftly to market demands. This strategic use of North Star KPI metrics has not only led to increased productivity and customer satisfaction but has also paved the way for their expansion into the brick-and-mortar retail space.

So, how can you replicate this kind of success in your business? How do you identify and integrate a North Star KPI that can truly transform your strategic outcomes? Let’s dive into how choosing the right KPIs, much like Dolls Kill did, can align your team’s efforts and lead to remarkable growth and alignment.

What is a North Star KPI Metric?

A North Star KPI (Key Performance Indicator) metric is the single most important metric that covers the core value your business delivers to its customers. It directly reflects the company’s long-term success and is closely tied to its overall mission. Unlike regular KPIs, which might measure specific processes or outcomes, a North Star KPI provides a focal point that all other metrics and business activities orbit around.

For example, for a tech company in the UK, the North Star KPI metric UK might be user engagement, whereas for a healthcare provider, patient satisfaction scores could be the focus. Choosing the right North Star KPI metric requires a deep understanding of what drives your business and what your customers value most.

Significance of North Star KPI Metrics in Business Strategy

  1. Alignment and Focus: North Star KPIs keep every department within the organization aligned to the ultimate goal. Whether marketing, sales, development, or customer service, each team understands how their efforts contribute to this overarching metric.
  2. Decision Making: By concentrating on a North Star KPI, decision-makers have a clear benchmark for making strategic choices, ensuring that resources and efforts are invested in initiatives that move the needle on that KPI.
  3. Performance Measurement: It simplifies the measurement of progress towards strategic goals, making it easier to evaluate the effectiveness of different strategies and initiatives.

Identifying Your North Star Metric

Identifying a North Star Metric that truly aligns with your business’s core value proposition is a strategic imperative for companies aiming to achieve sustained growth and alignment across all functions. 

Step-by-Step Guide to Identifying Your North Star Metric

  1. Understanding Your Core Value Proposition
  • Begin by articulating what your business uniquely offers to customers. This core value should be what distinguishes you in the marketplace and is the foundation of your North Star Metric.
  • For example, if your company specializes in software, your core value might be the efficiency and productivity your product brings to users.
  1. Mapping Core Values to Potential Metrics
  • List out all the metrics that could potentially reflect your core value. These might include customer engagement rates, retention rates, or average revenue per user, depending on your specific value proposition.
  • Use the SMART KPI framework to evaluate these metrics: Ensure they are Specific, Measurable, Achievable, Relevant, and Time-bound.
  1. Gathering and Analyzing Data
  • Collect data on each of these potential metrics. This might involve analytics tools, customer feedback, and industry benchmarks.
  • Analyze this data to see which metrics most closely correlate with business success and customer satisfaction.
  1. Testing and Refinement
  • After selecting a potential North Star Metric, test its predictive power and relevance over time. Monitor how changes to this metric affect other aspects of the business.
  • Refine your choice based on these observations and continue to test until you find the metric that best aligns with your core value and business outcomes.

Here's a table summarizing the North Star KPI examples across different industries:

Key Considerations

Customer Value:

  • The chosen North Star Metric should directly reflect the value customers gain from your product or service. If customers value time-savings above all, a metric like average time saved per user might be your North Star.

Business Model:

  • Consider how your business model influences which metrics you should prioritize. A subscription-based model might focus on retention rate, whereas a transaction-based model might look at purchase frequency or average order value.

Scalability:

  • Your North Star Metric should scale with your business. It needs to remain relevant and indicative of success whether your customer base is small or large.

Integrating North Star KPIs into Your Business Strategy

Strategic Planning Integration

  • Embed at the Foundation: Begin by incorporating your North Star KPI into the strategic planning phase. This involves defining your business's long-term vision and objectives in terms of your North Star KPI. For instance, if your KPI metric in the UK is customer lifetime value, all strategic initiatives should aim to enhance this value.
  • Leadership Endorsement: Ensure that your leadership team not only understands but also champions this KPI metric in every strategic communication and decision-making process. Their advocacy will underscore its importance throughout the organization.

Decision-Making Alignment

  • Policy and Process Integration: Modify your company’s policies and processes to ensure that decisions at all levels can be evaluated based on their impact on the North Star KPI. For example, before launching a new marketing campaign, analyze how it is projected to influence the North Star KPI.
  • Resource Allocation: Allocate resources such as budgets, manpower, and technology based on their potential to improve the North Star KPI. This prioritization ensures that the most impactful areas receive the necessary support to drive results.

Breaking Down the North Star into Department-Specific KPIs

  • Relatable Metrics: Translate the overarching North Star KPI into specific, relatable metrics that each department can influence directly. Taking a North Star metric example, if the metric is the overall revenue growth, the marketing department might focus on KPI metrics like lead conversion rates, while sales might concentrate on closing rates.
  • Use of SMART KPI Principles: Ensure that these department-specific KPIs adhere to SMART criteria—making them Specific, Measurable, Achievable, Relevant, and Time-bound. This alignment, crucial for establishing KPI and smart goals, ensures clarity and attainability, driving departmental accountability and focus.

Integration and Communication

  • Regular Reviews: Hold regular strategic review meetings where departments report on their progress towards their specific KPIs and how these contribute to the North Star metric. This keeps teams accountable and maintains focus on the broader business goals.
  • Cross-Departmental Collaboration: Encourage collaboration between departments to address any challenges that might be affecting their ability to meet their KPIs, reinforcing the interconnected nature of departmental goals and the North Star KPI.

Leveraging Data Visualization and BI Tools

  • Selection of the Right Tools: Choose BI tools that offer real-time tracking capabilities and are capable of integrating various data streams that impact your North Star KPI. The KPI dashboard should be customizable to reflect the unique metrics important to each department while maintaining an overview of the North Star metric.

Afterall, what is a KPI Dashboard? if not a visualization tool that displays critical KPIs at both the departmental and organizational levels. It provides a snapshot of performance and is essential for monitoring the health and progress of your strategic goals.

Optimization Tips for KPI Dashboards

  • User-Friendly Design: Design KPI dashboards that are intuitive and easy to use. Ensure that they can be accessed by all relevant team members, from executives to department heads, allowing for transparent visibility into KPI performance.
  • Training and Support: Provide training sessions for all users to ensure they understand how to interpret the dashboard data effectively. Ongoing support and updates to the KPI dashboard will help maintain its effectiveness as business needs evolve.

Conclusion

As you embark on this journey of strategic alignment through North Star KPIs, remember that the right tools are vital for tracking and analyzing these metrics effectively. Platforms like Grow.com offer robust solutions that can help you visualize, monitor, and manage your KPIs efficiently. With Grow’s intuitive KPI dashboards, you can ensure that your North Star metric is always front and center, providing your team with the real-time data needed to make informed decisions quickly.

To truly understand how Grow.com can revolutionize the way you use North Star KPIs, why not experience it firsthand? Sign up for a 14-day free trial and explore the array of features designed to enhance your strategic initiatives. Additionally, for an unbiased opinion on the platform's effectiveness and value, check out the Grow Cost & Reviews on Capterra. See how other businesses like yours are leveraging Grow to align their teams and drive success.

Embrace the power of strategic alignment with Grow.com, and start making the most out of your North Star KPIs today. Your journey towards more streamlined, goal-focused, and data-driven business operations begins here.

Gravatar

Did you know that the predictive analytics market is soaring to new heights, triple in value by 2026? Imagine the possibilities if your Business Intelligence platform could tap into that growth. But what if it can do more than just tap into it? What if your BI tool could actually lead the charge in defining future industry trends?

In 2021, the market for predictive analytics was valued at a hefty $10.5 billion. Thanks to the relentless pace of AI and machine learning, by 2026, it's projected to balloon to $28.1 billion. This isn't just growth; it's a revolution in data-driven decision-making. But what does this mean for you, and how can your Business Intelligence software company ensure you're not just riding the wave but actually steering the ship?

Every forward-thinking business is looking to gain that edge, and your Business Intelligence tool holds the key. It's not just about understanding the present—it's about anticipating the future. With the right Business Intelligence platform, equipped with cutting-edge AI and machine learning capabilities, could you not only foresee upcoming trends but also shape them?

In this blog, we’ll unveil how leveraging the power of predictive analytics within your Business Intelligence platforms can transform vast data landscapes into crystal-clear roadmaps for the future. 

Are you ready to unlock the predictive power of your BI platform and move from hindsight to foresight? Let's explore how the leaders in Business Intelligence tools are not just keeping up with the trends, but setting them.

Understanding the Predictive Power of BI

In Business Intelligence, predictive analytics is the use of data, statistical tools, and machine learning to figure out how likely it is that something will happen in the future based on what has happened in the past. Essentially, a Business Intelligence platform harnesses predictive analytics to provide forecasts that help businesses anticipate outcomes and trends.

Unlike traditional BI, which focuses solely on what has happened or what is happening, predictive BI is all about what could happen next. This forward-looking approach enables companies to make more informed decisions, taking proactive steps rather than reactive ones.

Key Features of a Predictive BI Platform

1. Data Integration: The Foundation for Predictive Insights

Before a BI platform can predict anything, it needs data—lots of it, from a variety of sources. Data integration capabilities allow your Business Intelligence tool to pull information from internal databases, social media feeds, market research, and industry reports, creating a comprehensive dataset that is rich and varied.

A multinational corporation integrates data from its global sales, customer feedback, and external market conditions into its BI platform. This comprehensive data pool allows for more accurate and encompassing trend analysis, providing insights that are not evident from isolated data sets.

How It Proves Predictive Capability: 

By having a holistic view of data, your Business Intelligence platform is better equipped to identify emerging trends that are consistent across different data sources, increasing the reliability of the predictions made.

Ensuring Data Consistency: Integrating data helps standardize information, which is crucial for maintaining consistency. Predictive models require consistent data formats to perform accurately. For instance, integrating customer data from different systems can standardize diverse customer identifiers and purchase histories into a unified format that is more conducive to analysis.

Eliminating Data Silos: Data silos occur when different departments within an organization use data that is not accessible by other parts of the organization. Data integration breaks down these silos, ensuring that all relevant data is available for comprehensive analysis. This is essential for predictive models, which rely on data from multiple business functions to generate accurate forecasts.

Richer Training Datasets: Machine learning models, which are at the heart of predictive analytics, thrive on large, diverse datasets. But, only a handful of Business Intelligence software companies can deliver value in such cases. Data integration provides these models with a variety of data points, which helps in uncovering more complex patterns and interactions between variables. This richness significantly improves the model's accuracy and predictive quality.

2 Advanced Analytics: The Engine for Prediction

With a robust dataset in place, the next step is analysis. Advanced analytics tools like regression analysis, forecasting, and cluster analysis are not just fancy terms—they are powerful techniques that sift through vast amounts of data to spot patterns and predict future outcomes.

Foundations of Advanced Analytics in BI

Regression Analysis: Regression analysis helps in identifying and quantifying the relationships between variables. For instance, a BI platform might use regression analysis to determine the impact of marketing spend on sales revenue. By understanding these relationships, businesses can make more informed predictions about how changes in one area (like budget adjustments) will affect outcomes (such as sales figures).

Forecasting: Forecasting uses historical data to predict future events. This can be as simple as using past sales data to predict future sales or as complex as using economic indicators to forecast market trends. BI tools utilize various forecasting models, from traditional statistical models to more sophisticated machine learning models, to provide businesses with predictions about future conditions.

Cluster Analysis: Cluster analysis groups together similar data points based on their characteristics. In a business context, this can help identify distinct customer segments based on purchasing behavior or demographic similarities. Understanding these segments can aid in predicting trends within each group, allowing for more targeted marketing strategies.

Using time-series forecasting, a retail company's BI platform analyzes 5 years of customer purchase data alongside seasonal trends and economic indicators. The platform predicts a surge in demand for certain products in the upcoming quarter, allowing the company to adjust its inventory and marketing strategies proactively.

How It Proves Predictive Capability: 

These sophisticated tools allow businesses to move beyond simple guesswork, providing scientifically-backed predictions based on historical data and analytics models. This capability demonstrates how a BI tool can indeed forecast future industry trends.

Enhanced Forecast Accuracy: Advanced analytics improve the accuracy of predictions by analyzing complex datasets and identifying patterns that are not apparent through simple observation. For example, a Business Intelligence tool might predict customer churn by analyzing patterns in customer activity, transaction histories, and engagement levels. The accuracy of these predictions is often significantly higher than those made using traditional methods, proving the predictive capability of the platform.

Dynamic Adaptation to Market Conditions: Advanced analytics tools enable Business Intelligence Platforms to adapt predictions based on real-time data. For example, during an unforeseen event like a market downturn, forecasting models can adjust predictions for financial performance or consumer behavior based on the latest data, proving the system’s ability to maintain relevance under changing conditions.

Quantifiable Business Outcomes: The ultimate proof of predictive capability is the impact on business outcomes. Advanced analytics in BI platforms can lead to tangible business improvements, such as increased efficiency, reduced costs, and enhanced customer satisfaction. For instance, predictive maintenance can foresee equipment failures before they occur, significantly reducing downtime and maintenance costs.

  1. Real-Time Processing and Visualization: Turning Insights into Action

The real power of predictive analytics is realized when insights can be acted upon quickly. Real-time data processing combined with dynamic visualization tools enables businesses to see and react to trends as they unfold.

Suppose, a financial services firm uses its BI tool to monitor real-time transaction data. The platform quickly identifies an unusual pattern indicating potential fraud. This immediate insight allows the firm to halt suspicious transactions before significant losses occur.

How It Proves Predictive Capability: 

Real-time data processing ensures that the insights provided by your BI platform are always relevant and current, allowing businesses to make decisions based on the very latest data. Visualization tools help disseminate these insights across the organization in an understandable format, ensuring swift and informed decision-making.


  • Real-Time Data Processing in Predictive Analytics


Immediate Data Availability: Real-time data processing ensures that data collected from various sources is immediately available for analysis. This immediacy is crucial in environments where conditions change rapidly, such as financial markets or supply chain management. By processing data as it arrives, BI platforms can quickly identify and respond to emerging trends or anomalies.

Enhanced Model Accuracy: The predictive models in BI tools depend heavily on the freshness of the data they use. With real-time processing, these models are continuously updated with the latest inputs, which helps maintain their accuracy and relevance. This is particularly important for predictive models used in dynamic sectors like retail or online services, where consumer behavior can shift dramatically in a short time.


  • Visualization for Predictive Insights


Interactive Dashboards and Reports: Visualization tools such as dashboards and interactive reports transform complex datasets into understandable and actionable insights. These tools allow users to see patterns and correlations that might not be evident from raw data alone, making it easier to predict future trends.

Facilitating Faster Decision-Making: By presenting data in an easy-to-digest format, visualization tools enable quicker decision-making. Stakeholders can assess the current state of affairs at a glance and make informed decisions without needing to parse through extensive reports or raw data tables.

A logistics company uses a BI platform that provides real-time dashboards showing vehicle locations, traffic conditions, and delivery statuses. This visualization allows management to predict and mitigate potential delays by rerouting vehicles or adjusting delivery schedules on the fly.


  • Synergy of Real-Time Processing and Visualization


Combined Impact on Predictive Analytics: When real-time data processing and visualization work together, they amplify the predictive capabilities of BI platforms. Real-time processing feeds fresh data into predictive models, ensuring that the insights drawn are timely and relevant. Visualization then turns these insights into visual formats that are easy to understand and act upon, even for those without deep technical expertise. 

Proving Predictive Capability: The ability of a BI platform to combine these features and provide timely, accurate predictions can be seen in industries like finance and health care. For example, real-time stock trading platforms analyze vast amounts of financial data in real-time, allowing traders to predict stock movements based on the latest market trends. Similarly, in health care, real-time data processing and visualization help predict patient care needs, enhancing the ability to provide proactive treatment.

Conclusion

As we've seen, the capabilities of Business Intelligence platforms are transforming businesses into forward-thinking, trend-setting powerhouses. The climb from a $10.5 billion industry to a projected $28.1 billion by 2026 is the value that predictive analytics brings to the table. It's an exciting time to be at the front of data analytics, where every piece of data holds the potential to unlock new opportunities and guide strategic decision-making.

Your BI platform is not just a tool; it's your gateway to understanding and leading in your industry. With the integration of AI and Machine learning, along with real-time data processing and visualization, you're not just keeping pace with industry trends—you're predicting them. Only a limited few Business Intelligence software companies can offer you such cutting-edge technology.

If you're looking to not only participate in this growth but also drive it, consider what a Business Intelligence tool like Grow can offer. With a 14-day free trial, you have the opportunity to experience firsthand how Grow can amplify your data’s value and convert it into actionable insights. Dive into the 'Grow Reviews 2024' to hear from businesses just like yours that have transformed their strategy and operations using Grow's advanced BI capabilities.

Don't let the future be a series of missed opportunities. Instead, make the most of the present with tools that can provide a window into tomorrow’s trends. Start your journey with Grow today, and step into a world where your data doesn't just tell a story—it predicts the sequel.

Your next business breakthrough is waiting—grab it with the right BI platform.

Gravatar

How do you ensure that your organization is not just surviving but thriving?

The answer often lies in choosing the best Business Intelligence software. But what exactly sets the top BI tools apart from the rest? Why is choosing the right working BI software not just a necessity but a game-changer for your business?

Imagine having the ability to harness the full power of your data with ease, turning insights into action faster than ever before. Isn't that what every business strives for?

The Business Intelligence tools benefits go beyond simple data analysis—they empower organizations to make strategic decisions that can define their future. From small businesses to large enterprises, the impact of using the best Business Intelligence tools is profound, affecting every aspect of operations and strategic planning.

So, what should you look for in BI software to ensure you're getting the best value and performance? 

This blog will dive deep into the essential factors that elevate the best BI software above the competition. Whether you're a seasoned data analyst or a business user eager to understand how BI can transform your operations, understanding these key elements will help you make an informed decision. 

Ready to discover how the right BI tools can revolutionize your business? Let's get started.

What Sets Apart the Best Business Intelligence Software?

  1. Integration and Compatibility

The ability of BI software to integrate seamlessly with a variety of data sources, applications, and existing IT infrastructure is a critical determinant of its utility and effectiveness. Seamless integration ensures that data flows smoothly from diverse sources into the BI system, where it can be processed and analyzed. This capability is essential for organizations that rely on real-time data to make informed decisions.

For it to be the best Business Intelligence software, it must support a wide range of data connectors and APIs that allow for easy connections with different databases, ERP systems, and cloud services. This flexibility not only simplifies the initial setup but also reduces potential data silos within an organization, promoting a more unified data environment.

Example: Grow BI Tool stands out as a working BI tool due to its robust integration capabilities with a wide range of applications, including CRMs like Salesforce, ERP systems like NetSuite, and various databases. This enables Grow to provide comprehensive insights across all business operations by consolidating data from disparate sources into one streamlined dashboard, enhancing both visibility and decision-making capabilities.

Compatibility extends beyond mere connectivity; it affects every user interaction with the BI tool. When BI software is compatible with a business’s existing platforms, it minimizes the learning curve and enhances user adoption rates. The best Business Intelligence tools are designed to work within the familiar interfaces and workflows that employees are accustomed to, which significantly improves user experience and operational efficiency.

Moreover, compatibility affects data management in several ways. First, it ensures data integrity by reducing the risk of errors during data transfer. Second, it facilitates better data governance as compatible systems are more likely to adhere to the same standards and protocols, ensuring that data handling remains compliant and secure.

2. Customization and Scalability

Customization: Customization means making the BI software fit your specific business needs. This allows for:

  • Better adoption: Users are more likely to embrace software that feels familiar and meets their specific needs.
  • Relevance: Custom features ensure the software provides insights that are directly useful to your business.
  • Flexibility: As your business evolves, so can your pre-exsiting working BI tools, without needing to start from scratch.

Scalability: Scalability is about the BI software growing with your business. This means:

  • Future-proofing: As your business grows, your BI system can handle more data and more users without a hitch.
  • Cost efficiency: You can save money in the long run as you won’t need to keep buying new software to meet increased demands.
  • Maintained performance: Even as data and usage grow, the system's performance stays strong, ensuring quick and effective decision-making.

Combining Both: The best Business Intelligence software bring both customization and scalability together, making sure the tool not only fits your business perfectly but also grows with it. This approach saves money, enhances efficiency, and keeps your operations agile.

3. User Interface and Experience 

The primary goal of an effectively working BI tool UI is to make complex data comprehensible and actionable for all users, regardless of their technical expertise. An intuitive design:

  • Reduces Training Time: A user-friendly interface decreases the time and resources spent on training employees. Tools that are easy to navigate increase productivity by allowing users to start working with data sooner.

  • Enhances Data Interaction: Interactive dashboards and drag-and-drop functionalities make it easier for users to manipulate data and generate insights. This hands-on interaction encourages a deeper understanding and exploration of data.

Example: Grow is renowned for its intuitive design and no-code approach, which allows users to easily create and interact with sophisticated visualizations, making complex data analyses more accessible to non-technical users.

Visualization and Dashboard Functionality

Effective BI tools excel in their ability to visualize data in ways that are easy to understand and visually appealing. Good visualization capabilities:

  • Improve Comprehension: Well-designed charts and graphs help users quickly grasp complex information. Effective visualizations can highlight trends, outliers, and patterns that might be missed in raw data.

  • Enhance Decision Making: Dynamic and customizable dashboards allow users to focus on metrics that matter most to their specific roles or business needs, supporting better, data-driven decisions.

Example: Grow BI provides users with extensive customization options for dashboards and reports, enabling them to tailor visualizations to meet their specific business requirements.

Real-World Feedback on UI/UX

Feedback from actual users plays a crucial role in shaping the UI/UX of BI tools. BI developers often use this feedback to:

  • Identify Pain Points: Understanding where users struggle helps developers optimize workflows and interfaces to address those challenges.

  • Drive Continuous Improvement: Regular updates based on user feedback ensure that your already working BI tools evolves in a way that continues to meet the changing needs of its user base.

Impact on User Adoption and Satisfaction

The UI and UX of a BI tool are critical determinants of its adoption rate and overall satisfaction among users. A well-designed interface and positive user experience lead to:

  • Higher Adoption Rates: When users find software easy and pleasant to use, they are more likely to utilize it consistently.

  • Increased ROI: Effective use of BI tools can lead to better insights, more informed decisions, and ultimately, a higher return on investment for the organization.

Read, Do Grow's BI Tool Shows Its True ROI?

4. Advanced Analytics and AI Capabilities

Advanced analytics extends beyond traditional data analysis techniques by incorporating sophisticated statistical models, machine learning, and big data technologies. These capabilities allow businesses to uncover hidden patterns, complex relationships, and potential future trends from their data.

Key Benefits:

  • Predictive Insights: Advanced analytics enables predictive modeling, which uses historical data to forecast future trends, helping businesses anticipate market changes and customer behavior.
  • Increased Accuracy: Machine learning algorithms improve over time, learning from new data to refine their predictions and recommendations, which enhances the accuracy of insights.

AI Integration in BI Tools

BI tools with AI can automate routine data analysis tasks, so analysts can work on more complicated and strategic tasks. AI enhances BI tools in several ways:

  • Automated Data Preparation: AI algorithms can automate the cleaning and preparation of data, a task that traditionally consumes a significant portion of analysts' time.
  • Natural Language Processing (NLP): AI-powered NLP allows users to interact with BI systems using natural language queries, making data analysis more accessible to non-technical users.

Predictive Analytics and Machine Learning

The integration of predictive analytics and machine learning within BI tools represents a leap forward in how businesses can operationalize data. These technologies not only predict future scenarios but also provide recommendations for optimal outcomes.

Key Benefits:

  • Proactive Decision Making: With predictive analytics, businesses can take a proactive approach to solving problems and seizing opportunities by anticipating them before they occur.
  • Personalized Customer Experiences: Machine learning algorithms can analyze customer data to deliver personalized experiences, significantly improving customer satisfaction and retention.

Example: Salesforce Einstein Analytics embeds machine learning to deliver predictive insights directly within its CRM platform, enabling sales and marketing professionals to better predict customer behaviors and tailor their strategies accordingly.

5. Security and Compliance Features

Security features in BI software are designed to protect data from unauthorized access and breaches. Given the vast amounts of sensitive information that BI systems handle, the security of these systems is paramount.

Key Security Features:

  • Data Encryption: Encryption both at rest and in transit ensures that data is unreadable to unauthorized users. The best Business Intelligence tools employ strong encryption standards to secure data.
  • Access Controls: Robust access control mechanisms ensure that only authorized personnel have access to specific levels of data. This can be managed through role-based access controls (RBAC), which are critical in minimizing the risk of data exposure.
  • Audit Logs: Keeping detailed logs of who accessed what data and when helps in monitoring the system for any suspicious activity and is essential for forensic analysis in case of a security incident.

Example: Grow incorporates advanced security protocols, including data encryption and detailed audit trails, to ensure data security and regulatory compliance.

Compliance with Global Data Protection Regulations

Compliance is another cornerstone of BI software, especially for organizations operating in regulated industries or in multiple countries. Compliance with laws like GDPR in Europe or HIPAA in the United States is mandatory and necessitates specific features within BI tools.

Key Compliance Features:

  • Data Masking and Anonymization: To comply with privacy laws, the best Business Intelligence software offers data masking features which ensure that personal information is obscured or anonymized in reports.
  • Compliance Reports: Automated tools for generating reports that show auditors and regulators that the company is complying with relevant laws and regulations.

Example: Microsoft Power BI includes features that help organizations comply with GDPR, such as data classification, data loss prevention capabilities, and extensive compliance documentation.

Integrating Security and Compliance in Working BI Tools

The best Business Intelligence tools integrate security and compliance into the core architecture of their products. This integration is crucial for maintaining trust and ensuring that the BI tools can be used effectively without risking data breaches or non-compliance penalties.

Benefits of Integrated Security and Compliance:

  • Trust and Reliability: When users trust the security and compliance capabilities of their BI tools, they are more likely to use the tool to its full potential.
  • Reduced Legal and Financial Risk: Effective security and compliance features reduce the risk of costly legal issues and fines related to data breaches or failures to comply with laws.

Example: Grow, recognized as one of the best Business Intelligence tools, offers extensive security features, including user authentication and permission settings, alongside compliance. 

Conclusion

Deciding on the right BI software can seem daunting, but understanding the key features that distinguish the best tools is important for leveraging the transformative power of your data. The Business Intelligence tools benefits include enhanced decision-making capabilities, increased operational efficiencies, and the ability to unearth actionable insights that can significantly propel your business forward.

As you weigh your options, consider a tool that not only meets your current needs but also grows with your business. Grow BI tool is an excellent example of such a solution. It blends ease of use with robust analytical capabilities, making it ideal for businesses of all sizes aiming to scale efficiently.

Why not see for yourself? Take advantage of Grow's 14-day free trial to experience firsthand how it can streamline your data analysis processes. And don’t just take our word for it—check out Grow Reviews from Verified Users on Capterra to hear directly from users who have transformed their approach to data with Grow.

Choosing the best BI software is more than just a technological upgrade—it's a strategic decision that impacts every layer of your organization. With the right tools, your data doesn’t just inform you—it drives you forward. So why wait? Start your trial with Grow today, and take the first step towards unlocking the full potential of your Business Intelligence.

Gravatar

Data quality issues often manifest as duplicate records, incorrect entries, and missing values, among other discrepancies. 

For instance, a retail company might find that sales data discrepancies due to duplicate entries are causing an overestimation of inventory needs, leading to overstocking. Poor data quality like this can skew the analytics in Business Intelligence software, resulting in flawed business decisions.

The cost of ignoring such issues can be substantial, not only in monetary terms but also in lost opportunities and diminished trust in data-driven initiatives.

Key Data Cleansing Techniques for Enhanced BI


  • Normalization


Data is often sourced from various systems each with its unique structure and format. Without normalization, this data diversity can lead to inconsistencies that hinder accurate data analysis and reporting. For example, date formats can vary widely (MM/DD/YYYY, DD/MM/YYYY, YYYY-MM-DD), and without a standardized format, sorting and comparing dates accurately across systems would be problematic.

Benefits of Data Normalization

  1. Consistency: Uniform data formats across all systems and datasets allow for reliable data aggregation and comparison.
  2. Accuracy: Reduces errors during data analysis by ensuring that all data adheres to the same format and scale.
  3. Efficiency: Streamlines BI processes by simplifying data integration, storage, and retrieval, thereby enhancing performance.
  4. Improved Analytics: Facilitates more sophisticated analytics, as standardized data can be more easily subjected to various analytical techniques in Business Intelligence software.
  5. Scalability: As organizations grow and data becomes more complex, normalization ensures that new data sources can be seamlessly integrated into existing BI frameworks.

Normalization Techniques

The approach to normalization typically involves several key steps, each tailored to the specific requirements of the data and the intended use within the BI system:

  1. Assessment of Data Format Variability: Begin by cataloging the various data formats present in your datasets. This could involve different units of measurement, date formats, or categorical labels that vary across sources.
  2. Development of Standardization Rules: Define clear rules for how different data types should be formatted. This includes deciding on standard units of measure, date formats, text casing (e.g., all caps, title case), and numerical representations (e.g., decimal places).
  3. Application of Transformation Functions: Use functions within your BI tools to convert data to the chosen formats. For instance, SQL functions like CAST or CONVERT can change data types or formats, and string functions can adjust text data.
  4. Automating Normalization Processes: Implement automation scripts or use built-in features in BI software to apply these transformations routinely as new data loads into the system.
  5. Continuous Monitoring and Updating: Regularly review and refine the normalization rules to accommodate new data types or sources, ensuring ongoing consistency and accuracy.

2. Deduplication

Duplicate records often arise during data collection and integration from multiple sources, such as merging customer databases from different departments or importing historical data into a new BI software. These duplicates can distort analytics, such as inflating customer counts or misrepresenting sales figures, leading to erroneous business insights and decisions.

Benefits of Implementing Deduplication

  1. Improved Data Accuracy: By eliminating redundancies, deduplication enhances the precision of the data analytics performed by Business Intelligence tools.
  2. Enhanced Decision Making: Clean, non-redundant data ensures that business decisions are based on accurate and reliable data insights.
  3. Increased Efficiency: Reduces the data volume that BI solutions need to process, which can speed up analysis and reduce the load on system resources.
  4. Cost Savings: Lower storage requirements by eliminating unnecessary data duplication, thus optimizing infrastructure costs.
  5. Better Customer Insights: In scenarios involving customer data, deduplication helps in providing a unified view of each customer, which is crucial for effective customer relationship management and personalized marketing.

Deduplication Techniques and Methodologies

Implementing deduplication involves a series of strategic steps within BI environments:

  1. Data Identification: Use algorithms to scan through the dataset and identify potential duplicates. This might involve matching records based on key attributes such as names, addresses, or unique identifiers.
  2. Record Linkage: Establish rules for how records are linked. This might include exact match criteria or more complex fuzzy matching techniques that can identify non-identical duplicates (e.g., 'Jon Smith' vs. 'Jonathan Smith').
  3. Review and Resolution: Once potential duplicates are identified, data managers must decide whether to delete redundant records or merge them. Merging involves consolidating multiple entries into a single record while preserving important unique data from each.
  4. Automation of Deduplication Processes: Implement automated tools and scripts within your BI software that continuously perform deduplication. This is especially important in dynamic environments where new data is constantly added. Read Data Deduplication With AI.
  5. Continuous Monitoring and Improvement: Regularly update deduplication rules and processes to adapt to new data sources and changing business requirements.

3. Validation and Verification

Validation and verification are essential for maintaining high data quality by confirming that data inputs and outputs meet predefined standards and rules. In BI systems, where decision-making is heavily reliant on data, even minor inaccuracies can lead to significant financial losses, strategic missteps, and erosion of trust in data systems. Ensuring data integrity through rigorous validation and verification is, therefore, a key concern for business users, data analysts, and BI professionals.

Key Benefits of Robust Validation and Verification

  1. Enhanced Accuracy: Ensures that data used in BI analytics is correct and reliable, leading to more accurate business forecasts and strategies.
  2. Improved Compliance: Meets regulatory and internal standards, which is crucial for industries such as finance and healthcare where data handling is heavily regulated.
  3. Increased User Confidence: Builds trust among users in the reliability of the BI software, encouraging data-driven decision-making across the organization.
  4. Risk Reduction: Minimizes the risks associated with data errors, such as incorrect customer data leading to poor customer service experiences.

Effective Techniques for Validation and Verification in BI Systems

Implementing validation and verification within BI tools involves several strategic and technical measures designed to ensure data integrity at various stages of the data lifecycle:

  1. Data Input Validation: Ensures that incoming data into a BI solution adheres to specific format, type, and value constraints. This can be achieved by:
    • Setting up data type checks (e.g., ensuring numeric inputs are not accepted as text).
    • Implementing format validations (e.g., dates in YYYY-MM-DD format).
    • Applying range validations (e.g., discount rates between 0% and 50%).
  2. Data Output Verification: Verifies that outputs from Business Intelligence tools are consistent and accurate relative to the input data. This is particularly important after data transformation processes. Techniques include:
    • Cross-referencing outputs with external trusted datasets to confirm accuracy.
    • Using checksums and hashes to verify large datasets without needing to compare all data manually.
  3. Automated Testing: Incorporates automated tests that regularly validate and verify data within the Business Intelligence software. Automation ensures ongoing compliance and integrity, significantly reducing the manual effort required and the potential for human error.
  4. Data Quality Audits: Regular audits of data quality within BI tools, checking for consistency, accuracy, and adherence to business rules and standards.
  1. Missing Data Handling: Managing Incompleteness in BI Systems

Missing data can arise from various sources, such as errors in data entry, differences in data collection methods, or integration issues between disparate systems. In BI contexts, incomplete data can lead to biased decisions, misinformed strategies, and ultimately financial losses. Hence, robust handling of missing data is essential to leverage the full potential of Business Intelligence tools in driving organizational success.

Benefits of Effective Missing Data Management

  1. Improved Data Quality: Filling or properly handling missing data reduces biases and errors in BI reports.
  2. Enhanced Decision Making: Accurate and complete data ensures that decisions are based on the most comprehensive view of available information.
  3. Increased Reliability: BI software that reliably handles missing data builds confidence among users in the insights it generates.
  4. Regulatory Compliance: Adequate handling of gaps in data can also help meet compliance standards, which often require complete and accurate reporting.

Techniques for Managing Missing Data in BI Software

Effective management of missing data involves selecting the right strategy based on the nature of the data and the analytical goals of the BI solution. Here are several approaches commonly used in Business Intelligence software:

  1. Deletion:
    • Listwise Deletion: Removes all data records that contain any missing values, used when the missing data is random and sparse.
    • Pairwise Deletion: Utilizes available data in the analysis without deleting entire records, suitable for correlations where missing data is not pervasive.
  2. Imputation:
    • Mean/Median/Mode Imputation: Replaces missing values with the mean, median, or mode of the column, ideal for numerical data where additional data nuances are less critical.
    • Regression Imputation: Estimates missing values using linear regression, useful in scenarios where data relationships are strong and predictable.
    • K-Nearest Neighbors (KNN): Imputes values based on the 'k' closest neighbors to a given record, effective in more complex datasets where patterns can indicate missing data points.
  3. Using Algorithmic Approaches:
    • Multiple Imputation: Generates multiple versions of the dataset with different imputations, providing a comprehensive analysis of possible outcomes.
    • Maximum Likelihood Techniques: Utilizes a statistical model to estimate the most likely values of missing data, optimizing the overall data set's statistical properties.

Also, read Solving Data Inconsistencies: How Coalesce Transform Enhances BI Reporting

  1. Data Enrichment

Data enrichment is a crucial process in the realm of Business Intelligence (BI) that involves augmenting internal data with external data sources. This technique enhances the depth and breadth of datasets, providing more detailed insights that are critical for sophisticated analysis and decision-making. Effective data enrichment can transform BI software from a simple data reporting tool into a powerful decision support system. 

Benefits of Data Enrichment in BI Software

  1. Enhanced Decision-Making: Enriched data provides a more complete view of the business landscape, enabling more informed decisions.
  2. Improved Customer Insights: Adding demographic and psychographic data to customer records helps in creating more targeted marketing campaigns and personalized customer experiences.
  3. Increased Data Value: External data can reveal trends and patterns not visible with internal data alone, adding value to existing BI analytics.
  4. Risk Mitigation: Incorporating external data such as market trends and economic indicators can help companies anticipate changes and adjust strategies accordingly.

Strategies for Data Enrichment in BI Tools

Implementing data enrichment involves several key steps to ensure that the external data enhances the existing BI system effectively:

  1. Identifying Relevant Data Sources:
    • Determine what external data could complement the internal datasets. Common sources include social media feeds, economic reports, demographic information, and third-party databases.
    • Evaluate the credibility and reliability of these sources to ensure they meet the organization’s standards for data quality.
  2. Integrating Data:
    • Use APIs or data integration tools to automate the flow of external data into the BI solution. This integration must be secure to protect data integrity and privacy.
    • Match the external data with internal datasets accurately, which might involve techniques like record linkage, entity resolution, or fuzzy matching.
  3. Maintaining Data Quality:
    • Regularly validate and cleanse the integrated data to ensure it remains accurate and relevant. This is crucial as external data sources can change, impacting the quality and reliability of insights derived from Business Intelligence tools.
    • Monitor the external data sources for changes in data provision policies or quality to adjust the integration processes as necessary.

Conclusion

The accuracy and integrity of your data can make or break the insights derived from BI software. As we've explored throughout this blog, implementing robust data cleansing techniques is not just an option but a necessity for any business that relies on data to inform its decisions. From normalization and deduplication to validation, verification, and data enrichment, these strategies ensure that your data is not only accurate but also actionable.

If you're ready to take your BI capabilities to the next level and significantly reduce data accuracy issues, why not start with a tool designed to facilitate and streamline this process? Grow offers a comprehensive BI solution that integrates seamlessly with your existing systems, equipped with advanced features to help automate and manage data cleansing tasks efficiently.

Start your journey towards cleaner data and clearer insights today with Grow's 14-day free trial. Experience firsthand how easy and impactful cleaning your data can be when using the right tools.

Don't just take our word for it; check out the Grow.com Reviews & Product Details on G2 to see how other businesses like yours have transformed their data handling practices using Grow. Enhance your decision-making process, ensure data accuracy, and push your business forward with confidence.

Take action now to harness the full potential of your BI software with Grow. Sign up for your free trial and begin exploring the possibilities of a cleaner, more efficient data environment.

Your data deserves the best treatment, and with the right techniques and tools, you can ensure it supports your business effectively. Let Grow help you make the most of your data, starting today!

Gravatar

The speed and accuracy of your data analysis can mean the difference between staying ahead of the competition or falling behind. Data is growing at an unprecedented rate; according to Forbes, over 2.5 quintillion bytes of data are produced by humans every day. In such a landscape, having the right business analytics tools at your disposal is not just valuable—it's essential. SQL, or Structured Query Language, is the key to unlocking the potential of this data, offering precision, efficiency, and the flexibility needed to perform complex analyses and derive actionable insights.

Whether you're a business analyst at a data analytics company grappling with ever-changing market dynamics, a data scientist seeking to fine-tune predictive models, or a business leader striving to make data-backed decisions with sophisticated business analytics solutions, mastering a handful of essential SQL queries can transform your approach to data analysis. This blog post is dedicated to demystifying five crucial SQL queries that stand out for their ability to handle dynamic data analysis needs. These queries will help you not only to enhance your reporting capabilities but also to adapt more swiftly to the evolving demands of the business landscape, ensuring you make the most of your tools for business analytics.

Prepare to dive into the core of SQL techniques that will empower your data analysis, ensuring you remain agile and informed in a world where data never sleeps.

5 Basic SQL Queries for Dynamic Data Analysis

1. Dynamic Date Ranges for Time-Sensitive Analysis

Decision-making often hinges on having the most current data at your fingertips. Dynamic date ranges are essential for ensuring that the information used to guide decisions is both relevant and timely. By leveraging dynamic SQL queries, businesses can automate the process of data extraction over variable periods, such as the last 30 days, the previous month, or year-to-date. This capability not only streamlines workflows but also ensures that the data reflects recent trends and events, making it indispensable for real-time analysis.

The utilization of dynamic date ranges is particularly crucial in industries where conditions change rapidly, such as retail, finance, and online services. Here, the ability to quickly adapt and respond to information can be the difference between capitalizing on opportunities and falling behind competitors. This is where advanced business analytics tools come into play, providing the agility needed to navigate these changes effectively.

Example: Automating Reports with SQL

To illustrate the practical application of dynamic date ranges, consider a SQL query designed to automate the generation of reports for the last 30 days. 

This SQL script is designed to fetch sales data from the past 30 days, grouping the results by product name and ordering them by the total sales in descending order. It provides clear, actionable insights into which products are performing best, enabling businesses to adjust their strategies accordingly.

2. Conditional Aggregations for Multi-Dimensional Analysis

When it comes to data analysis, conditional aggregation stands as a potent technique that enables businesses to uncover nuanced insights from their datasets. This method involves the application of conditions within aggregation functions like SUM() and AVG(), allowing analysts to segment data dynamically based on specific business scenarios. By adopting this approach, companies using advanced business analytics tools can achieve a more granular understanding of their data, leading to more precise decision-making.

The importance of conditional aggregations extends across various business functions, from marketing and sales to finance and operations, highlighting its versatility and critical role in enhancing business analytics solutions. This technique is particularly valuable in environments where data-driven insights are necessary to optimize performance and respond effectively to market dynamics.

Example: Segmenting Data with SQL

Consider an SQL code snippet that segments sales data by product category to calculate the average sales, but only for those products achieving a minimum sales volume threshold. This segmentation allows businesses to focus on significant categories while excluding outliers or underperforming segments that might skew overall insights.

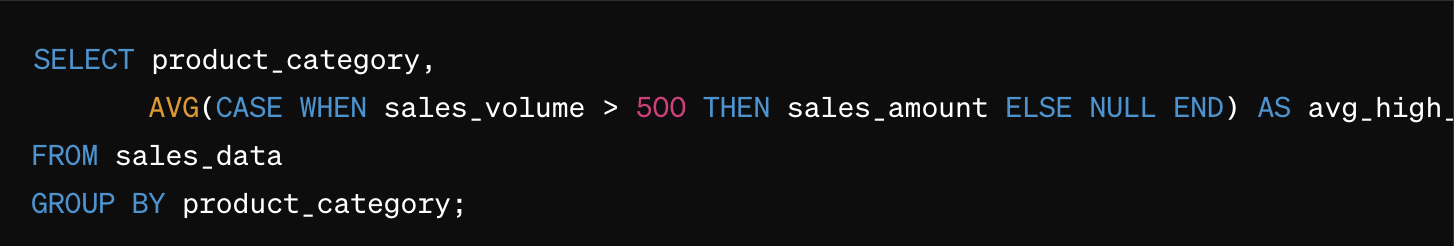
In this example, the CASE statement within the AVG() function calculates the average sales amount only for those entries where the sales volume exceeds 500 units. This method ensures that the averages reflect the performance of core product categories, thus providing a more accurate and relevant measure of success.

Business Impact: Tailoring Analytics to Business Needs

Conditional aggregations provide a customizable framework for data analysis that can be finely tuned to meet the specific needs of different business scenarios. This adaptability is crucial for companies striving to maintain precision in their strategic analyses and operational reports.

Enhancing Reporting Accuracy: By filtering and aggregating data based on predefined conditions, businesses ensure that their analytics outputs are not only accurate but also highly relevant to their specific operational contexts. This precision is essential for maintaining the integrity of business analytics reports and supports confident decision-making.

Tailoring to Market Needs: Different market segments and product lines may perform differently under varying conditions. Conditional aggregations allow businesses to dissect these differences and adapt their strategies accordingly. For instance, a data analytics company can help a retail client analyze seasonal performance variations across products, enabling targeted inventory strategies that align with anticipated demand.

Optimizing Business Strategies: By leveraging tools for business analytics with capabilities for conditional aggregation, companies can optimize their approaches to marketing campaigns, product development, and customer segmentation. This tailored analysis supports more effective targeting and resource allocation, ensuring that efforts are concentrated where they can generate the most significant impact.

3. Rolling Averages and Moving Sums for Trend Analysis

Understanding how metrics evolve over time is essential. Rolling averages and moving sums are critical tools for analyzing these trends over moving time windows, providing businesses with a smoothed view of data fluctuations. This smoothing effect helps in minimizing the noise associated with short-term variations, allowing for clearer trend analysis and better decision-making. Integrating these methodologies into tools for business analytics facilitates more dynamic and responsive business strategies.

Example: SQL for Calculating Rolling Averages and Moving Sums

To put these concepts into practice, consider a SQL query that calculates a 7-day rolling average and moving sum for daily sales. Such calculations are instrumental in identifying sales trends, helping businesses anticipate changes in consumer behavior.


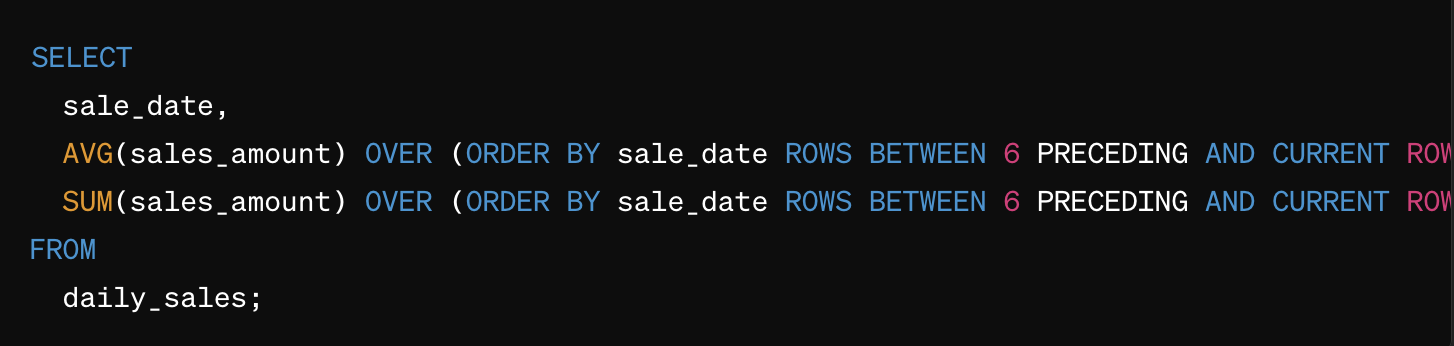
This query uses the OVER() clause with ORDER BY to specify the window of records used for each calculation, effectively creating a moving window that updates with each new record. The ROWS BETWEEN clause is key to defining the size of this window, in this case, the current day and the six preceding days.

Once the rolling averages and moving sums are calculated, visualizing these trends can vastly improve their interpretability. Business analytics tools often provide advanced visualization capabilities that can be leveraged to present these trends. 

Business Impact: Strategic Forecasting and Operational Planning

The application of rolling averages and moving sums significantly impacts forecasting and operational planning. These metrics allow businesses to predict future trends based on historical data, facilitating more informed strategic decisions.

Forecasting: By smoothing out variances, rolling averages provide a more reliable basis for forecasting sales, budget needs, or resource requirements. This is particularly useful in industries like retail or manufacturing where anticipating market demand can lead to optimized inventory management.

Operational Planning: Moving sums give a cumulative picture over the specified period, which can be crucial for operational decisions such as staffing and logistics. For example, a sudden increase in the moving sum of customer service calls might prompt a business to allocate more resources to their call centers.

Adaptive Strategies: With these insights, businesses can adapt more swiftly to market changes. This agility is often a competitive advantage, allowing firms to adjust pricing, promotions, and stock levels dynamically.

4. Recursive Queries for Hierarchical Data Exploration

In many sectors, from retail to manufacturing to corporate management, data is not flat but hierarchically structured. Understanding these hierarchical or nested relationships is crucial for effective data analysis and operational efficiency. Recursive queries, particularly through Common Table Expressions (CTEs), are powerful tools for business analytics that navigate and make sense of these complex data structures. They enable businesses to traverse and manipulate hierarchical data efficiently, which is essential for accurate reporting and strategic decision-making.

Example: Recursive CTE for Organizational Hierarchy

A practical example of a recursive CTE can illustrate how to explore an organizational hierarchy or product category structure. This type of query is invaluable for businesses that need to analyze data across various levels of granularity.

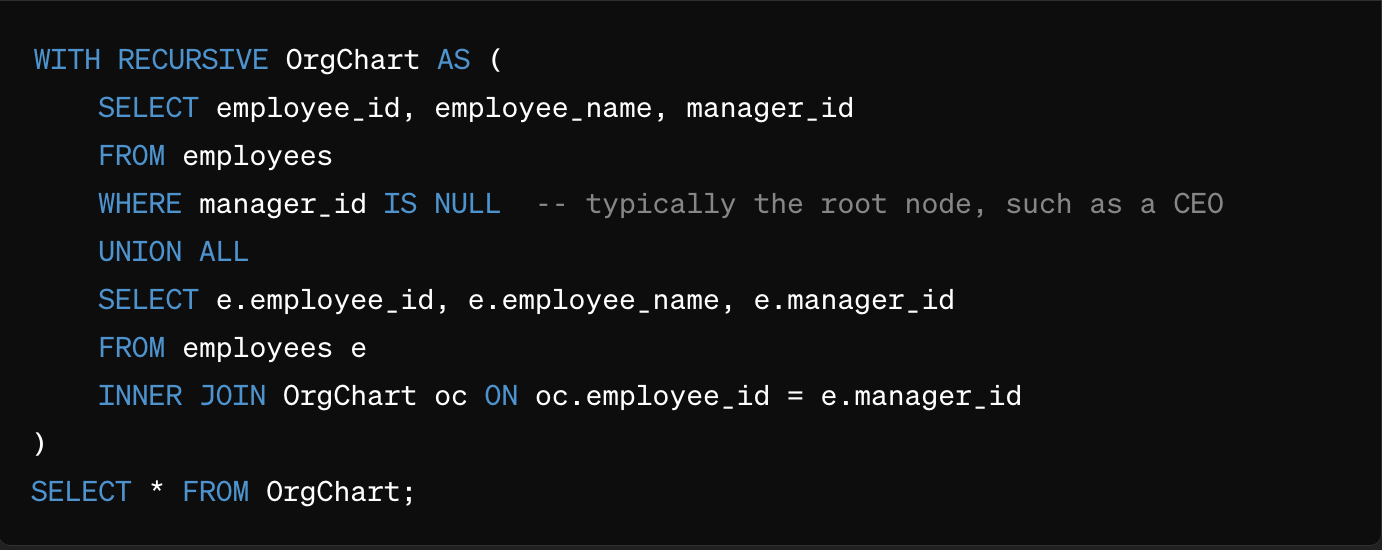
This SQL snippet initiates with the root of the hierarchy (e.g., the CEO who has no manager) and recursively joins the employee table to itself to fetch all subsequent levels of employees under each manager. The result is a comprehensive view of the organizational structure.

Business Impact: Enhancing Management and Operational Strategies

Understanding hierarchical relationships through recursive queries can significantly enhance various business operations by providing deep insights into organizational structure, product categories, and more.

Inventory Management: For retailers, recursive queries can map the entire product hierarchy, from broad categories down to individual SKUs. This detailed view supports better inventory decisions, helping managers understand which items are underperforming or overstocked, and how they relate to other items in the hierarchy.

Organizational Structure Analysis: In corporate settings, understanding the organizational hierarchy helps in optimizing management strategies and improving communication flows. It allows HR and management teams to ensure that resource allocation is aligned with company objectives and that every department or team is structured optimally to support its function.

Resource Allocation: By visualizing complex relationships, businesses can allocate resources more effectively. For example, in project management, understanding the dependencies between tasks (hierarchically related) is crucial for effective scheduling and resource allocation.

Strategic Planning: Recursive queries assist strategic planners by providing a clear view of the organizational or product structures. This insight is vital for planning expansions, reorganizations, or product line enhancements.

5. Pivot Tables for Dynamic Data Structuring and Reporting

Pivot tables in SQL offer a transformative approach to data analysis, providing the flexibility to convert row-based data into a column-based format for easier comparison and more intuitive insights. This capability is particularly valuable in environments where data needs to be quickly reorganized for various analytical purposes, enabling dynamic reporting and decision-making. As a crucial component of tools for business analytics, pivot tables help businesses manipulate and present data in customized views, thus enhancing the effectiveness of data-driven strategies.

Example: Creating a Pivot Table with SQL

To illustrate the practical use of SQL for generating pivot tables, consider a scenario where a business needs to analyze monthly sales data by product categories across different regions. The following SQL query demonstrates how to create a pivot table that summarizes this data, providing a clear overview of sales performance by region and category.

This query first selects the necessary data from the sales data table and then uses the PIVOT operator to transform this data into a format where each row represents a product category and each column represents a region, with the cells showing the sum of sales for each category-region pair. This transformation allows for quick cross-regional comparisons and trend identification.

Business Impact: Using Pivot Tables in Different Business Scenarios

Dynamic Financial Reporting: Pivot tables are indispensable in financial analysis, providing a structured way to display financial data, such as monthly revenues or expenses by department or region. This structure helps financial analysts and business leaders quickly assess financial health and make informed budgeting decisions.

Sales Data Analysis: In sales, pivot tables can be used to segment data in various ways, such as by product, time period, or demographic. This segmentation enables sales teams to identify which products are performing well in which markets, helping to tailor marketing strategies and optimize sales efforts.

Marketing Performance Metrics: For marketing teams, pivot tables offer a way to measure the effectiveness of different campaigns across various channels. By organizing campaign data into a pivot table format, marketers can compare the performance metrics (like conversion rates and ROI) across different campaigns, identifying the most successful strategies and areas for improvement.

Strategic Advantages: With the ability to quickly reorganize and summarize large datasets, pivot tables enhance the agility of business analytics solutions. This flexibility is crucial for adapting to market changes, enabling businesses to respond quickly with data-supported strategies. The use of pivot tables in business analytics tools helps companies maintain a competitive edge by allowing them to pivot their strategies based on real-time data analysis.

Conclusion

In this blog, we've explored five essential SQL queries that are important for dynamic data analysis, each serving as a key to unlocking deeper insights and enhancing business operations. From dynamic date ranges to sophisticated pivot tables, mastering these queries allows business users, data analysts, and BI professionals to leverage data in powerful, strategic ways. However, even with SQL expertise, the real magic happens when you combine these skills with advanced, user-friendly business analytics tools.

For those looking to streamline their data analysis further, Grow’s full-stack, no-code BI tools offer a compelling solution. Grow simplifies the complexity of data analytics by providing a no-code platform that integrates seamlessly with your existing data sources. Whether you're looking to implement rolling averages, recursive queries, or dynamic pivot tables, Grow’s intuitive interface and powerful functionality make it accessible to users at all technical levels.

Interested in seeing how Grow can transform your data analysis process? Take advantage of Grow's 14-day free trial to experience firsthand how easy and impactful data analytics can be when you have the right tools at your disposal. Dive into Grow's capabilities and discover why it is highly rated on platforms like Capterra Grow.com.

Don't miss out on the opportunity to enhance your business intelligence capabilities. Visit grow.com and start your free trial today. Empower your business with data insights that drive success – with Grow, you're not just running reports; you're growing your business.

Gravatar

As leaders, how often do we find ourselves deeply immersed in the hustle and bustle of our day-to-day operations, working closely with our teams to navigate the complex landscape of business data? Do you ever stop to wonder if you're really making the most of the vast amounts of data at your disposal?

Consider the experience of John Hawkins, founder and owner of Hawkins Law Firm, a seasoned personal injury and worker’s compensation firm in South Carolina. John and his team were no strangers to data; they had it in abundance. Yet, he openly admits, 

“Before Grow, it was a challenge trying to use the large amount of data that we had available to us.” 

They had the data, but the clarity and insights were missing. Their struggle isn’t unique. Like many businesses, they knew that visualizing their data could unlock understanding and drive strategic action—but how?

This is where the tool 'Grow' stepped in, transforming not just the Hawkins Law Firm but offering a glimpse into why many BI reporting tools fail at real-time analytics. Grow didn’t just collect data; it made data instantly understandable and actionable. “We were immediately able to track leads and status on current cases,” Hawkins reveals. Suddenly, the entire team—from attorneys to finance members—were not just seeing data but interacting with it in meaningful ways to stay on target with their goals.

Why do most BI reporting tools fall short where Grow succeeds? Many tools can gather and report data, but they falter in real-time processing and visualization, failing to offer the insights that businesses need when they need them. 

Let’s delve deeper into this issue and discover how we can overcome these common pitfalls in BI reports to make real-time analytics a basis of successful business intelligence.

What is Real-Time Analytics

In business intelligence, real-time data analytics refers to the ability to process and analyze data as soon as it enters the system, providing immediate insights and enabling instant decision-making. Unlike traditional methods that involve periodic updates, real-time analytics ensures that BI reports are always updated with the latest data. This capability is crucial in dynamic environments where conditions change rapidly, such as financial markets, online retail, and supply chain management.

Real-time data processing in BI reporting is marked by several distinctive characteristics:

  1. Speed and Timeliness: The foremost attribute of real-time analytics is the speed with which data is processed and made available. It's not just about fast processing but also about minimizing the latency between data creation and data usability.
  2. Continuous Analysis: Unlike batch processing, which runs at scheduled intervals, real-time processing involves continuous analysis of data streams. This ongoing process ensures that the data available in Business Intelligence reports is reflective of the most current state of affairs.
  3. Automated Triggers: Real-time systems often utilize triggers that automatically initiate actions based on specific data patterns or thresholds. For example, in fraud detection, a transaction that seems unusual can immediately trigger an alert or a preventive action.
  4. Scalability: Handling vast volumes of data in real-time requires systems that can scale rapidly without degrading performance. Effective real-time BI reporting tools must be able to manage fluctuations in data volume seamlessly.

The integration of real-time analytics into BI reporting tools is not without its technical challenges.

Data Volume and Velocity

One of the foremost challenges in real-time BI reporting is handling the massive volume and high velocity of incoming data. In real-time environments, data flows continuously, requiring BI tools to process and analyze data at speeds that traditional systems are often not designed to handle.

  • Impact on Systems: Traditional Business Intelligence reporting tools may struggle with this influx, leading to slow query responses and delayed reports. Such delays can undermine decision-making processes that rely on speed and accuracy.
  • Solutions: Optimizing data architecture with technologies such as in-memory databases and stream processing can help. These technologies allow for faster data ingestion and querying by reducing reliance on disk-based storage and handling data in a near real-time stream.

Integration Complexity

Real-time BI reporting requires the integration of various data sources, including IoT devices, customer interaction systems, and operational data stores. Each source may use different data formats and standards, complicating the integration process.

  • Challenges: The diversity of data types and sources can lead to significant integration hurdles. Mismatched data formats and incompatible systems can prevent the seamless flow of data, essential for accurate real-time analytics.
  • Strategies for Integration: Employing middleware solutions or adopting an API-first approach can facilitate smoother integration. These approaches help standardize data exchanges between different systems and platforms, ensuring that Business Intelligence report are both comprehensive and reliable.

Learn How Grow's KPI Dashboard Uses REST API

Performance and Scalability Issues

As organizations grow and data volumes increase, maintaining performance while scaling BI tools becomes a critical challenge. The ability of BI systems to scale effectively is crucial for sustaining the quality of real-time analytics.

  • Performance Bottlenecks: Without proper scalability, systems may experience bottlenecks that can lead to data latency and reduced operational efficiency.
  • Scalability Solutions: Cloud-based Business Intelligence reporting tools offer scalable solutions that can dynamically adjust resources based on demand. Adopting distributed architectures can also distribute the load across multiple nodes, enhancing both performance and reliability.

Limitations of Traditional BI Tools for Effective Real-Time Analytics

  1. Insufficient Real-Time Data Processing Capabilities

Stream processing is crucial for real-time data as it allows for continuous input and output of data streams. Without it, traditional BI tools must rely on periodic batch processing, which can delay insight generation and decision-making.

This inability to process data in real time can lead to outdated insights, potentially causing businesses to miss out on immediate opportunities or fail to respond to emerging threats swiftly.

  1. Limited Access to Advanced Analytics

Advanced analytics, including predictive analytics and machine learning, are increasingly important in real-time BI contexts. They enable predictive decision-making and trend spotting, which are crucial for proactive business strategies. However, traditional Business Intelligence reports often lack seamless integration with these advanced analytical tools.

Predictive analytics use historical data to forecast future outcomes, providing businesses with a predictive edge in their decision-making processes. Without these capabilities, businesses are less equipped to anticipate market changes.

Machine learning can significantly enhance real-time analytics by continuously improving data analysis processes based on incoming data. Traditional Business Intelligence reporting tools often do not support these integrations natively, hindering their ability to adapt and learn from new data effectively.

  1. Inadequate Visualization Options

Visualization is a critical component of data analytics, providing an intuitive way for users to understand complex data. However, real-time data visualization demands are significantly different and more complex than those for static data.

Real-time operations require dynamic visualizations that update automatically and instantly as new data flows in. Traditional BI tools often only provide static or slowly updating visuals, which are not suitable for real-time decision-making.

Effective real-time visualization tools should also offer interactive user interfaces that allow users to drill down into live data for deeper insights. Many traditional tools lack this level of interactivity, which can impede the user's ability to make informed decisions quickly.

Business Implications of Ineffective Real-Time Analytics


  • Delayed Decision Making


When real-time analytics are not effectively integrated into BI reporting tools, the lag in data processing and reporting can lead to delayed decision-making. In fast-moving sectors such as finance, retail, or technology, delays can be particularly detrimental, affecting everything from customer satisfaction to revenue generation.

Operational delays can escalate, affecting supply chain management, customer service response times, and even real-time pricing adjustments, all of which rely heavily on timely data insights.

Strategically, delays in decision-making can mean missed opportunities. For instance, a delayed market entry or an untimely stock purchase can result in significant financial losses or missed market share gains.


  • Risk of Data Overload


Ineffective real-time analytics often struggle to filter and prioritize the deluge of incoming data, leading to data overload. Without the ability to extract actionable insights swiftly, businesses can become overwhelmed, which obscures critical decision-making pathways.

The phenomenon of analysis paralysis, where decision-makers are overwhelmed by too much information and unable to act, is a common consequence of data overload. Effective Business Intelligence reports must not only present data but also highlight actionable insights.

Even the quality of insights can be compromised if BI reporting tools are not tailored to discern relevant data quickly. This scenario often leads to making decisions based on incomplete or irrelevant data, affecting the overall business efficacy.


  • Competitive Disadvantage


Perhaps the most significant impact of ineffective real-time analytics is the competitive disadvantage it creates. Companies that fail to leverage real-time insights effectively find themselves trailing behind competitors who are more adept at navigating the data-driven landscape.

In industries that are particularly volatile, such as e-commerce or telecommunications, the ability to adapt to market changes based on real-time data is crucial. Lack of adaptability can result in losing market share to more agile competitors.

Effective real-time analytics are often the backbone of innovation within companies, particularly those dealing with products and services that require rapid iteration based on user feedback and behavior. Inefficient real-time BI reports can stifle these innovations, preventing companies from evolving and meeting their customer's needs.

Conclusion

The challenges inherent in traditional BI reporting—ranging from insufficient real-time data processing capabilities to inadequate visualization options—highlight why many of these tools fall short of supporting effective real-time analytics. As businesses increasingly rely on immediate data insights to make informed decisions, the need for more capable and flexible solutions becomes undeniable.

Recognizing these needs, Grow offers a robust alternative that is designed to overcome the typical limitations of traditional BI reporting tools. With advanced data integration capabilities, dynamic visualization features, and real-time processing, Grow equips businesses to harness the power of their data without the common delays and complications associated with other platforms.

If your organization is experiencing the pitfalls of ineffective real-time analytics and you're looking for a solution that can provide comprehensive insights with minimal latency, consider exploring what Grow has to offer. With Grow's free trial, you have the opportunity to test out its features and see firsthand how it can streamline your data analysis processes and enhance your decision-making speed. 

  • Don't let outdated BI tools slow down your business. Sign up for Grow's 14-day free trial today and start experiencing the benefits of real-time analytics done right.
  • Learn more about how Grow can fit into your budget by checking the "Grow Pricing 2024 Capterra" for detailed pricing information and customer reviews.

Embrace the future of business intelligence with Grow BI reporting and turn real-time data into real-time growth.

Gravatar

Have you ever wondered how a high-end business like Edit Suits Co., known for its made-to-measure menswear and exceptional customer service, keeps up with the fast-paced demands of the fashion industry? How do they manage sprawling operations across continents while ensuring every customer feels uniquely catered to? Imagine being able to see your business data unfold in real time, turning every piece of information into an opportunity for growth. How dynamic would that be for your business?

Patrick Jungo, the co-founder of Edit Suits Co., faced a similar dilemma. With operations split between London and Singapore, the challenge wasn't just about managing teams or inventory—it was about harnessing and interpreting scattered data efficiently to make informed decisions swiftly. As the business grew, so did the complexity of managing data from various sources. 

"Information started to become more scattered," 

Patrick noted, as he realized the pressing need for a tool that could consolidate and track their data sources comprehensively.

Enter Grow—the data visualization software that became a game-changer for Edit Suits. With Grow, Patrick and his team could integrate all essential business aspects from marketing and sales to operations and customer service into one dynamic platform. Real-time inventory dashboards became particularly crucial. These dashboards allowed Edit Suits to monitor fabric levels actively, integrating directly with suppliers and significantly reducing the time spent on phone calls and manual checks. This integration not only streamlined operations but also ensured that they could meet customer demands without delay.

But how does this relate to you and your business? Whether you're managing a global enterprise or a local startup, the ability to visualize and act on your data in real time can redefine how you navigate challenges and seize opportunities. Are you ready to transform how you interact with your business data? Let’s explore how visualization software like Grow can help you keep your finger on the pulse of your business, ensuring you're not just responsive, but proactive in your industry.

The Role of Visualization Software in Real-Time Analytics

Data visualization software is a tool that enables businesses to convert raw data into graphical representations, leading to easier interpretation and quicker decision-making. At its core, it extracts data from various sources, processes it, and displays it in a visual context, such as graphs, charts, or maps. This type of software is crucial in real-time analytics because it allows businesses to see analytics visualized immediately as data flows in, enabling instant feedback and action.

For business intelligence data visualization, these tools are not just about presenting data attractively; they are about making data comprehensible at a glance. The power of data visualization software lies in its ability to highlight trends, outliers, and patterns that might go unnoticed in raw numerical data. 

Moreover, with the growth in no-code data visualization platforms, these tools have become accessible to non-technical users, democratizing data and empowering a broader base within an organization to engage with analytics directly.

Types of Data Visualizations Typically Used in Real-Time Scenarios

In real-time analytics, certain types of visualizations are preferred due to their ability to update dynamically and display changes as they happen. Here are some of the most effective types:

  1. Dynamic Dashboards: These are among the most common tools in business intelligence data visualization. Dynamic dashboards offer a real-time view of business metrics and performance indicators. They are highly customizable and can include a variety of widget-like components such as gauges, charts, and graphs that update continuously as new data arrives. Dashboard visualization is crucial for roles that require constant monitoring of systems, such as network operations centers or live digital marketing campaigns. 
  2. Interactive Charts: Unlike static charts, interactive charts allow users to manipulate the view of the data to better understand different aspects of the information presented. This might include zooming in on a specific time frame, or drilling down into the data to view more detailed subcategories. Interactive charts are particularly valuable in financial services for tracking market movements in real time.
  3. Geospatial Maps: For industries like logistics or regional sales, geospatial maps provide real-time tracking of vehicles, goods, or sales performance across different regions. These visualizations are useful for optimizing routes in real time or responding to sales trends as they develop.
  4. Heat Maps: Often used in website analytics and retail, heat maps show areas of intensity and can be updated in real time to reflect visitor behavior on a website or customer movements within a store.

Each of these visualization types is supported by no-code data visualization platforms, which allow even non-technical users to create and customize real-time analytics tools without the need for programming skills. This democratization of data tools extends the power of data insights across the organizational hierarchy with a more informed decision-making culture.

Benefits of Data Visualization Software in Real-Time Data Analysis

Immediate Data Comprehension

Data visualization software revolutionizes how businesses interpret vast amounts of information by converting complex data sets into intuitive visual formats. This transformation is crucial in real-time data analysis, where the speed of understanding can directly influence operational success. Visualization software facilitates immediate comprehension in several ways:

  • Visual Simplicity: Complex numerical data and metrics are simplified through visual means such as graphs, charts, and maps, making them accessible at a glance. This simplicity is crucial during high-pressure situations where time constraints do not allow for detailed analysis of raw data.
  • Pattern Recognition: Humans are naturally visual creatures, and visualization aids in quickly identifying trends and anomalies. For instance, a sudden dip in a line graph can indicate performance issues that need immediate attention, while a spike might highlight unexpected successes or opportunities.
  • Contextual Awareness: Good visualization provides context, essential for understanding the 'why' and 'how' behind data points. Dashboard visualization, a common feature in business intelligence data visualization platforms, integrates data from multiple sources into a single interface, offering a holistic view of operations.

These capabilities, especially when enhanced by no-code data visualization platforms, enable not just data scientists but also non-technical business users to access, understand, and react to data promptly.

Enhanced Decision-Making

Real-time data visualization not only accelerates the comprehension of data but also enriches the decision-making process. Enhanced decision-making is observed in various scenarios, such as operational adjustments, strategic pivots, and crisis management, among others. Below are some examples where real-time data visualization has directly improved business decisions:

  • Operational Efficiency: In manufacturing, real-time dashboard visualizations monitor assembly line performance, allowing managers to identify bottlenecks or malfunctions immediately. This quick identification and resolution of issues prevent prolonged downtime and optimize production flow.
  • Customer Interactions: Retail businesses use heat maps to track customer movements within stores. This real-time data helps adjust staffing and merchandising decisions on the fly, enhancing the customer experience and increasing sales.
  • Financial Trading: In financial markets, traders use interactive charts to monitor live data streams of market conditions. The ability to visualize and analyze trends in real-time enables traders to make quicker, more informed trading decisions, potentially leading to significant financial gains.
  • Emergency Response: Visualization tools aid emergency response teams by providing real-time geographic data visualization of incidents and resource deployment, improving response times and resource allocation.

These examples demonstrate how real-time data visualization can transform decision-making processes, providing businesses with the agility to respond effectively to both opportunities and threats as they arise.

Key Features of Effective Visualization Tools

Real-Time Updating and Responsiveness

The ability of data visualization software to update and respond in real-time is fundamental in today's fast-paced business environments. This feature ensures that the data displayed is not only current but also reflective of the very latest changes and inputs. The technical underpinnings that enable these capabilities include:

  • Streaming Data Integration: Effective visualization tools are equipped with capabilities to handle streaming data. This allows the software to continuously receive and process data as it comes in, which is crucial for industries like finance and telecommunications where conditions change second by second.
  • Performance Optimization: To manage large volumes of data updating in real-time, visualization software must be optimized for high performance. This involves advanced data caching, efficient data indexing, and the use of just-in-time data loading techniques to ensure that the visualization remains fluid and responsive without overwhelming system resources.
  • Responsive Design: Visualization tools must display data correctly across different devices and platforms. This adaptability ensures that decision-makers can access insights on the go, using any device, without delays or distortions in data presentation.

These features collectively ensure that business intelligence data visualization remains a reliable cornerstone for decisions that depend on the latest information.

Interactivity and User Control

Interactivity in data visualization software allows users to engage with data more deeply by manipulating what they see to uncover different layers of analysis. Key aspects of interactivity and user control include:

  • Drill-Down Capabilities: Users can click on visual elements to explore underlying data. For instance, clicking on a segment of a sales performance dashboard might reveal individual transaction details, allowing analysts to investigate anomalies or trends more thoroughly.
  • Dynamic Filtering: This feature enables users to change the parameters of the data they are viewing. For example, a user could adjust a dashboard visualization to display data for a specific time period, region, or product category, enabling tailored analysis without needing to exit the interface.
  • Customization Options: Effective tools offer extensive customization options, from changing visual types (e.g., from bar charts to scatter plots) to altering how data is grouped or summarized. No-code data visualization platforms particularly excel in this area, providing powerful customization without requiring users to write any code.

These interactive features empower users to explore data from multiple angles and derive insights that are most relevant to their specific needs or questions.

Integration Capabilities

The ability to integrate seamlessly with existing data systems and workflows is crucial for any data visualization tool, ensuring that it acts as a natural extension of the business’s analytical capabilities rather than as a standalone element. Integration capabilities include:

  • Compatibility with Multiple Data Sources: Effective visualization tools can pull data from various sources, such as databases, cloud storage, and third-party applications. This is crucial for businesses that store data across different platforms.
  • APIs and Embedding Features: Many advanced visualization platforms provide APIs that allow developers to integrate visualization features directly into existing systems or workflows. Similarly, embedding features let organizations place interactive visual dashboards within internal or customer-facing applications.
  • Collaboration Features: Integration isn’t just about data; it’s also about people. Tools that support real-time collaboration enable teams to work together on data analysis tasks, share insights quickly, and make decisions more efficiently.

Conclusion

In an era where data is continually generated and decisions need to be made at unprecedented speeds, visualization software has proven indispensable. By transforming complex data sets into clear, intuitive visual representations, such tools not only streamline the process of data interpretation but also significantly enhance the ability of organizations to respond to real-time challenges and opportunities. The use of data visualization software in real-time analytics allows businesses to not just keep pace with their data, but to lead with it, driving better decisions, faster actions, and ultimately, greater success.

If you're looking to empower your business with these capabilities, consider exploring the solutions offered by Grow. With Grow's advanced data visualization tools, you can gain the clarity and insight needed to navigate your business through the complexities of today's data-driven landscape. 

Start with Grow’s 14-day free trial to experience firsthand how effective and user-friendly these tools can be. Also, to make an informed decision, look up “Grow Cost & Reviews on Capterra” to see what other users are saying about their experiences.

Gravatar

Are you struggling to keep up with the rapid shifts in consumer behavior and market trends? Do you find it challenging to determine which marketing strategies are truly driving your business forward? In a world where data is king, staying ahead requires more than just guesswork—it demands a deep, data-driven understanding of your market and customers.

Marketing dashboards are your ultimate tool for navigating the complex marketplace with precision and insight. These dashboards, a crucial component of modern BI dashboard software, offer a real-time snapshot of your marketing's effectiveness, presenting complex data in an easily digestible format. But what makes them truly indispensable in today's digital landscape?


Using advanced Business Intelligence dashboard software, these dashboards not only help you track key performance indicators but also enable you to slice through the noise to focus on what matters most. How are your current campaigns performing across different platforms? Are your marketing efforts aligning with consumer expectations?

With robust Business Analytics dashboard capabilities, you can gain an unparalleled view into consumer preferences and emerging market trends. This isn't just about seeing the numbers; it's about understanding the story they tell and reacting swiftly and strategically.

Are you ready to transform your approach to marketing with tools that enable not just visualization but also foresight and adaptability? Let’s explore how marketing dashboards can change the game for your business, helping you to not only meet but anticipate the needs and desires of your customers.

What are Marketing Dashboards?

A marketing dashboard is an interactive tool that visually tracks, analyzes, and displays key marketing metrics, KPIs, and other data points related to marketing performance. By consolidating data from various sources—like social media, CRM systems, and email marketing campaigns—into a cohesive dashboard, businesses can assess their performance against their marketing goals swiftly and effectively.

The Role of Marketing Dashboards in Identifying Market Trends


  • Real-Time Data Analysis


Real-time data visualization is a key feature of sophisticated Business Intelligence dashboard software, allowing companies to monitor market dynamics as they unfold. This immediate insight is crucial for identifying and capitalizing on emerging trends before they become widely recognized. 

For instance, a marketing dashboard can display live data streams from social media and website interactions, providing marketing professionals with instant feedback on campaign performance and consumer engagement levels. This capability enables marketers to tweak campaigns in real-time, enhancing their effectiveness and relevance to the target audience.

A practical example is the use of real-time dashboards in e-commerce during high-traffic events like Black Friday. By monitoring live data, retailers can see which products are trending, adjust promotions instantaneously, and manage inventory more efficiently, thus maximizing sales opportunities.


  • Comparative Analysis


Comparative analysis involves juxtaposing historical data against current metrics to discern patterns and shifts in consumer behavior. Marketing dashboards excel in this area by aggregating data over various periods, presenting a clear view of performance trends over time. Business Intelligence dashboard software can display year-over-year growth, compare seasonal sales, and benchmark current campaign performance against past efforts.

For example, a company might use its business analytics dashboard to compare the success of two different marketing campaigns for the same product launched at different times of the year. Insights gleaned from such comparisons could reveal that campaigns launched in the summer yielded higher engagement rates compared to those in winter, prompting a strategic realignment to capitalize on peak interest seasons.


  • Predictive Analytics


Predictive analytics in marketing dashboards uses machine learning models to analyze existing data and predict future market trends. This proactive approach allows businesses to anticipate market developments and align their strategies accordingly, rather than merely reacting to past events. Business Intelligence dashboard software can analyze patterns from historical data and consumer interactions to forecast future behaviors with a reasonable degree of accuracy.

A compelling application of predictive analytics can be seen in the retail sector, where marketing dashboards analyze customer purchase history and online behavior to predict upcoming purchasing trends. This might involve anticipating an increase in demand for certain products and adjusting marketing strategies to focus on those items before the demand actually arises.

Enhancing Understanding of Consumer Preferences through Marketing Dashboards


  • Segmentation and Targeting


Segmentation and targeting are fundamental in crafting effective marketing strategies, and marketing dashboards provide the necessary tools to achieve this with precision. By integrating data from various sources—such as social media analytics, online shopping behaviors, and demographic information—BI dashboard software allows marketers to create detailed consumer profiles.

For instance, a business intelligence dashboard can segment consumers based on age, location, purchasing habits, and even engagement levels with previous marketing campaigns. This segmentation enables marketers to identify which demographic groups are most likely to respond to specific marketing initiatives. 

A dashboard might reveal that millennials in urban areas show a high engagement rate with digital ads for tech gadgets, guiding a tech company to target similar products specifically to this group.


  • Personalization Opportunities


Personalization is a key driver of marketing success in the digital age, and insights from marketing dashboards are invaluable in this regard. Business analytics dashboards can analyze consumer behavior patterns to tailor marketing messages, offers, and product recommendations. This level of personalization not only improves customer satisfaction but also enhances the effectiveness of marketing campaigns.

Using BI dashboard software, marketers can craft personalized email marketing campaigns that address consumers by name, reference their past purchases, and suggest similar products they might enjoy. This approach not only increases the likelihood of repeat purchases but also fosters a deeper connection between the brand and the consumer, as customers feel recognized and valued on an individual level.


  • Feedback Loops


Feedback loops are essential for continual improvement in product offerings and marketing strategies. Marketing dashboards facilitate this by incorporating consumer feedback directly into the data visualization tools, enabling companies to quickly adapt to consumer needs and preferences.

A practical example of this is in product development. Suppose a dashboard shows a consistent decline in sales for a particular product line while customer feedback collected via surveys and social media points to specific dissatisfaction with certain features. The company can use this information to make informed decisions about product improvements or to develop new products that align better with consumer expectations.

Moreover, feedback loops can also refine marketing strategies. If dashboard data indicates that a particular marketing channel is underperforming, and customer feedback suggests a lack of engagement with the content delivered through that channel, marketers can adjust their strategies accordingly—perhaps by changing the messaging, the medium, or even the timing of ads.

Conclusion

By integrating sophisticated BI dashboard software and comprehensive data analytics, marketing dashboards provide a clearer, more accurate view of the market. They enable businesses to swiftly identify emerging trends, understand complex consumer behaviors, and refine marketing strategies with precision—ensuring that every decision is data-driven and every strategy is optimized for success.

For those looking to leverage the full potential of marketing dashboards, Grow offers an intuitive solution that can help transform your data into actionable insights. With Grow's data dashboard, businesses can enjoy seamless integration with existing systems, robust data analytics, and user-friendly visualizations that make interpreting complex datasets easy.

Take the first step towards revolutionizing your marketing strategies by signing up for Grow's 14-day free trial. Experience firsthand how Grow can enhance your ability to track, analyze, and respond to market trends and consumer preferences.

Additionally, to see how others have successfully implemented and benefited from Grow, check out the reviews on "Grow data dashboard Trustradius." Here, you'll find comprehensive user feedback and ratings that highlight the effectiveness and versatility of Grow dashboards.

Don't wait to adapt to market changes—anticipate them with a reliable marketing dashboard from Grow. Start your free trial today and begin your journey toward more informed, effective marketing decisions.

Gravatar

Have you ever wondered how some companies seem to effortlessly manage their data, spotting opportunities and optimizing operations on the fly? What if you could unlock similar potential in your data, discovering insights that could transform your business’s cash flow and decision-making? 

Imagine, in just 60 days, significantly cutting down on unpaid invoices, just like Altaworx did, ultimately freeing up $40,000 in cash flow that was previously untapped. 

Even if that were the only metric I had for our experience with Grow, I’d use it just for that,” states Forrest Derr, Director of Finance and Automation at Altaworx.

In this era where data drives decisions, the right tools can make all the difference. Altaworx uses Grow BI dashboards not just to monitor data but to revolutionize how they manage their business. 

From swiftly updating dashboard metrics without the need for extensive coding to improving visibility across their accounts receivable, the impact of effective dashboard software like Grow is profound and multifaceted. 

They’ve optimized their revenue funnel, redirected their marketing strategies, and ensured that every team member from the break room to the boardroom is aligned and informed.

Are you ready to explore how the best dashboard software can change your perspective on data visualization and business management? Let’s dive into how tools like Grow can transform data from a static metric into a dynamic tool for growth and strategic advantage.

Understanding Data Visualization Challenges

1. The Complexity of Modern Data

As businesses evolve, they generate vast amounts of data at unprecedented speeds and in various formats. The sheer volume of data (big data) can overwhelm traditional systems, while the velocity demands rapid processing and analysis. Variety adds another layer of complexity with data coming in structured, semi-structured, and unstructured forms. This triad challenges even the best dashboard software, pushing the limits of conventional data visualization tools.

Conventional tools often lack the scalability and agility to manage this complex data efficiently. They struggle with large datasets, resulting in slow load times and frequent system crashes, which impede the visualization process. As the data grows in volume and complexity, these tools often require manual intervention to handle diverse data types, leading to delayed insights. In contrast, the best Business Intelligence dashboards are designed to handle this complexity by leveraging advanced data integration, processing, and visualization technologies.

2. Integration Issues

In today’s interconnected world, businesses use various applications and systems, each generating data in different formats. Integrating this data into a unified view is crucial for comprehensive analysis yet poses a significant challenge. Traditional tools often lack the capability to connect seamlessly with multiple data sources, forcing companies to invest in additional middleware or custom solutions, which can be costly and inefficient.

When data remains siloed or improperly integrated, the resulting insights are fragmented and possibly inaccurate. This disjointed data can lead businesses to make decisions based on incomplete or outdated information, significantly impacting operational efficiency and strategic planning. The best data dashboard software excels in integrating data from multiple sources, providing a holistic view that ensures the accuracy and timeliness of insights.

3. Limitations of Conventional Tools

With the increasing need for on-the-go decision-making, mobile accessibility has become crucial. Traditional visualization tools often fail to provide real-time updates or seamless mobile experiences. This limitation hinders the ability of decision-makers to access vital business insights from anywhere, at any time.

Features of Advanced Dashboard Software


  • Real-Time Data Processing


Advanced dashboard software harnesses the power of real-time data processing, enabling businesses to monitor operations as they happen. This capability is crucial in environments where conditions change rapidly, such as financial trading floors or supply chain operations. By processing data the moment it is received, the best dashboard software ensures that the visualizations are always current, reflecting the latest available information.


The immediate advantage of real-time data visualization is the ability to react swiftly to emerging trends or issues before they escalate. For instance, in manufacturing, real-time data can signal a production fault that, if addressed promptly, could prevent costly downtime. Additionally, marketing teams can monitor campaign performance live and tweak strategies to maximize effectiveness. Such timely insights can be pivotal in maintaining a competitive edge.


  • Integration Capabilities


One of the key strengths of the best Business Intelligence dashboards is their robust integration capabilities. These tools are designed to seamlessly aggregate data from diverse sources—be it CRM systems, ERP software, or social media analytics—into a coherent dashboard. This integration is facilitated through APIs and connectors that are built to handle various data formats and sources without requiring extensive manual input.

Leading BI dashboard tools like Tableau and Grow offer extensive integration options. These platforms come equipped with pre-built connectors that link directly to popular data sources, enabling businesses to start visualizing their data almost immediately. 


  • User-Centric Design and Customizability


The effectiveness of a BI dashboard tool hinges significantly on its usability. Advanced dashboard software is designed with a user-centric approach, ensuring that the interface is intuitive enough for users at all levels of technical expertise. This accessibility is crucial for building a data-driven culture within an organization, as it empowers more employees to derive insights independently, without constant IT support.

The best data dashboard software offers extensive customization options, allowing businesses to tailor their dashboards to meet specific operational needs and user preferences. Users can modify layouts, choose from various visualization tools, and even set up personalized alerts. Such customizability not only enhances the user experience but also ensures that the insights generated are relevant and actionable.


  • Mobile Accessibility and Cloud-Based Solutions


Decision-makers often need to access data and insights while away from their desks. Mobile accessibility has become a critical feature of the best dashboard software, enabling users to view and interact with their dashboards through smartphones and tablets. This flexibility allows for immediate decision-making, anytime and anywhere, which is essential for maintaining operational continuity and responsiveness.

Cloud-based BI dashboard tools offer significant advantages, especially in a remote work context. These solutions allow users to access data and tools online without the need for local installations, facilitating collaboration among dispersed teams. 

Moreover, cloud solutions ensure that all data is centrally stored and updated in real-time, reducing the risk of discrepancies and ensuring consistency across all user interactions.

The Business Impact of Effective Dashboard Software


  • Enhanced Decision-Making


Effective visualization provided by the best dashboard software translates complex data into comprehensible visuals, facilitating quicker and more informed decision-making. These tools enable users to identify trends, anomalies, and patterns that might be overlooked in raw data. By presenting data in a visual context, dashboards help decision-makers synthesize information rapidly and make well-informed choices with greater confidence.

Let’s look at this example. 

The introduction of Grow as a comprehensive dashboard tool helped Patrick and Edit Suits Co. consolidate various data sources into a single platform. The executive dashboard, nicknamed "the Force," enabled the management team to monitor the main KPIs for each department in one place, significantly enhancing the decision-making process by providing a unified and instant overview of critical business metrics.


  • Improved Collaboration


Shareable dashboards, a key feature of the best Business Intelligence dashboards, facilitate seamless collaboration across teams by providing a unified data view accessible to all relevant stakeholders. This shared access eliminates information silos, aligns team objectives, and encourages a collaborative approach to problem-solving and project management.


For example-

A manufacturer of industrial equipment used dashboard software to link production line data with supply chain management. The shared dashboard allowed for real-time adjustments in production based on supply chain updates, enhancing responsiveness and efficiency.


  • Increased ROI


Investing in the best data dashboard software typically yields a high return on investment by streamlining processes, reducing errors, and uncovering revenue-enhancing opportunities. These tools minimize the time spent on data collection and analysis, thus freeing up resources for strategic tasks that directly contribute to business growth.

Cost-Benefit Analysis of Investing in High-Quality Dashboard Software:

  • Costs Involved: Initial setup, licensing fees, training, and maintenance.
  • Benefits Gained: Increased operational efficiency, reduced downtime, improved decision-making speed and accuracy, and enhanced customer satisfaction.

"Grow has allowed us to be far more proactive," states Tim Langford, VP of Operations at Comapi,  noting that easy visibility of customer revenue figures and the ability to take action immediately helps maintain and increase financial performance.

Conclusion

The ability to quickly interpret and act on information is important for any business seeking to maintain a competitive edge. The challenges associated with data visualization are real, from integrating multiple data sources to ensuring real-time data processing and mobile accessibility. 

The best dashboard software, such as Grow, addresses these challenges head-on, providing businesses with the tools they need to transform raw data into actionable insights effortlessly.

Grow's dashboard software stands out by offering seamless integrations, real-time data updates, and user-friendly interfaces that cater to all levels of technical expertise. Whether you're looking to enhance decision-making, improve collaboration across teams, or increase your return on investment, Grow provides a comprehensive solution that meets the complex demands of modern businesses.

If you're ready to change your perspective on data visualization and see how advanced dashboard tools can streamline your operations, we invite you to try Grow for yourself. 

Sign up for a 14-day free demo at Grow.com and experience the difference firsthand. For unbiased reviews and business experiences, visit "Grow with Grow.com TrustRadius" to see how other businesses like yours have transformed their data practices. 

Unlock the full potential of your data—start growing with Grow today!

Gravatar

Are you confident that your Business Intelligence tool is as smart as it claims to be? 

How often do you encounter discrepancies between the insights generated by your BI reporting tools and the actual outcomes? In the fast-evolving world of data analysis, having a Business Analytics tool that genuinely meets your needs is more crucial than ever. While hopes are high, reality often falls short.

While 97% of organizations are investing in big data and AI, only 29% of those surveyed believe they have derived actionable insights from their data. This gap is a critical disconnect between the capabilities of Business Analytics solutions and their practical applications.


As we dive deeper, we'll explore the complexities and limitations of current Business Analytics tools. From overestimated automation capabilities to the nuances of data quality and context, we will uncover why these tools might not be as intelligent or as universally applicable as you might think. 

Join us as we dissect the myths and realities of Business Intelligence tools, setting the stage for a more informed approach to leveraging these technologies in your business.

Key Limitations of Current Business Analytics Tools

Data Quality and Integrity

One of the most significant challenges faced by Business Intelligence tools is the quality of the data they process. BI reporting tools are only as good as the data fed into them. Poor data quality—be it incomplete data sets, incorrect entries, or outdated information—can lead to inaccurate outputs and misguided business decisions.

For instance, a common issue in BI implementations is the failure to maintain clean and updated data repositories. When Business Analytics tools process this compromised data, the insights generated can lead to flawed strategic decisions. This was the case for a retail chain that relied on outdated customer data, resulting in a marketing campaign that targeted the wrong demographic, wasting substantial resources and opportunities.

Lack of Contextual Understanding

While Business Analytics tools excel at processing large volumes of data, they often lack the ability to understand the context behind the data. This limitation is critical because data without context can mislead rather than guide.

For example, during an economic downturn, a sudden drop in sales might be interpreted by a Business Intelligence tool as a performance issue rather than a market-wide trend. Without the ability to contextualize data, companies might wrongly penalize certain departments or make poor strategic decisions. This lack of contextual understanding emphasizes the need for human oversight in interpreting what the analytics tools report.

Over-Reliance on Automation

Automation in Business Analytics solutions is intended to streamline processes, reduce labor costs, and improve efficiency. However, an over-reliance on automation can lead to significant issues, particularly when unexpected anomalies or new trends occur in the data.

A relevant case involved an automated BI system that failed to flag a gradual but significant decline in product quality, which was reflected in customer feedback and return rates. The system was programmed to monitor sales volumes and revenue but not customer satisfaction metrics directly. This oversight led to a continued decline in brand reputation and customer loyalty, which took months to identify and address.

The Misconception of 'One-Size-Fits-All' Business Analytics Solutions

Businesses frequently deploy the same BI reporting tools across various departments without considering the unique analytical needs and data processing requirements of each. For instance, the marketing department and the finance department have vastly different data analytics needs. Marketing might require deep insights into consumer behavior and campaign performance, involving lots of unstructured data and sentiment analysis, which are less critical for finance, which focuses on cost, revenue, and economic forecasts.

Using a uniform Business Analytics tool across these departments can lead to scenarios where the tool does not fully support the sophisticated data visualization required by marketing or the regulatory compliance needed by finance. This can result in suboptimal data insights and potentially misguide strategic decisions.

For example, a Business Analytics solution that excels in financial forecasting may not necessarily be the best tool for analyzing customer behavior or managing supply chain logistics. When organizations adopt a one-size-fits-all approach, they often miss out on features that are more suited to specific types of data analysis, leading to suboptimal outcomes.

Commonly Misunderstood and Misapplied Advanced Features

Feature Complexity and Interface Challenges 

Advanced features like machine learning models or complex data integrations in Business Intelligence tools can intimidate users due to their perceived complexity. For example, the use of R or Python scripts within BI reporting tools to run predictive models requires a level of programming knowledge that not all business analysts possess.

Solution: Implement user-friendly interfaces that provide guided analytics and simplified access to complex functionalities. For instance, BI tools could incorporate natural language processing (NLP) to allow users to make complex queries without needing to write code. Additionally, providing access to pre-built models and wizards that guide the user through the analytics process can help demystify these features.

Technical Breakdown of Misunderstood Features

Predictive Analytics 

Technical Barrier: The integration of predictive analytics often requires a deep understanding of statistical modeling and data science principles, which goes beyond traditional BI competencies.

Solution: Develop a suite of template-driven analytics models tailored for specific industries and departments. For instance, create retail-specific models that automatically adjust for seasonal trends and promotional impacts, or finance-specific models that are attuned to economic cycles.

Data Mining 

Technical Barrier: Effective data mining requires not just an analysis across broad data sets but also the ability to clean and preprocess data effectively, which involves handling missing values, outlier detection, and ensuring data normalization.

Solution: Enhance BI reporting tools with automated data preprocessing modules that can detect and correct common data issues before the mining process begins. Integrate visual data mining tools that allow users to easily segment data and visualize patterns without requiring extensive statistical knowledge.

Real-Time Data Processing 

Technical Barrier: Real-time data processing demands robust infrastructure and the capability to integrate streaming data effectively with batch-processing data systems.

Solution: Leverage cloud-based BI solutions that offer scalability to handle large streams of real-time data. Implement hybrid transactional/analytical processing (HTAP) capabilities to enable real-time analytics on transactional databases without the need for additional data movement.

Conclusion

As we have explored throughout this discussion, the perceived intelligence of your Business Analytics tool might not fully align with reality. From the challenges of maintaining data quality to the pitfalls of over-reliance on automation, it's clear that while these tools are powerful, they are not infallible. They require a keen understanding of their capabilities, careful integration into business processes, and ongoing management to truly deliver on their promises.

The key takeaway is not to dismiss your current analytics solutions but to enhance how you use them. It’s about recognizing their limitations and proactively filling the gaps—be it through better data practices, enhanced training, or more tailored solutions. This approach will not only improve your current analytics outcomes but also pave the way for more sophisticated use of these technologies.

For those looking to explore new analytics solutions or enhance their current tools, consider experimenting with advanced platforms that offer more customization and integration flexibility. For instance, Grow provides a dynamic Business Intelligence tool tailored to meet specific business needs, allowing for more precise and actionable insights. 

With Grow, you can take advantage of a 14-day free trial to see how its capabilities align with your business goals. Check out Grow.com Reviews & Ratings 2024 on TrustRadius for unbiased user feedback and see how Grow stands out in the marketplace.

Remember, the goal of business analytics is not just to collect data but to drive meaningful business decisions. As you move forward, take a moment to reassess your tools, refine your strategies, and ensure that your business intelligence is as smart as you need it to be. Explore, experiment, and expand your analytics capabilities with Grow, and take your data-driven decision-making to the next level.