News
 
Gravatar

"Is Manual Data Analysis Obsolete?" This question, central to the current debate in data management, challenges us to examine the evolving role of traditional analysis in the age of advanced Business Intelligence software. But one might ask, "What are the benefits of automated BI solutions?" and "How does BI software improve decision-making speed?" Many business leaders are thinking about these questions right now.

In an era where a BI solution is not just a tool but a game-changer, can we definitively say that manual methods are a thing of the past? Or does the value of human-led analysis still hold weight in certain aspects of business intelligence?

While the majority of respondents from this survey believe in the data-driven decision-making, do you?

Consider the landscape: recent studies show that businesses implementing a comprehensive BI solution have experienced up to a 5X faster decision-making time. The efficiency and precision offered by state-of-the-art Business Intelligence services are undeniable. Yet, the role of manual analysis remains fitting in scenarios where human insight is key, such as in interpreting complex, subjective customer sentiments or strategic brainstorming sessions where human creativity and experience are irreplaceable.

As we delve into this topic, we will explore both sides of this debate, weighing the advantages of automated BI solutions against the enduring value of manual data analysis.

The Era of Manual Data Analysis 

In the early stages of business data handling, before the widespread advent of Business Intelligence software, manual data analysis was not just a method but an essential business practice. This era, characterized by human-led processes, was foundational in shaping how we understand and utilize business data today.

What is Manual Data Analysis

Manual data analysis involves a meticulous process of collecting, sorting, and analyzing data by hand or using basic software tools. It required significant human effort, with analysts spending hours, sometimes days, delving into spreadsheets and reports. This approach, while time-consuming, had the advantage of human intuition and understanding, often leading to nuanced insights.

The Limitations and Challenges

However, the limitations of manual data analysis soon became apparent as the volume of business data skyrocketed. The primary challenges included:

  1. Time-Consuming Processes: Analysts often found themselves bogged down by the sheer amount of data, leading to delays in decision-making.
  2. Error-Prone Analysis: Human errors in data entry or interpretation were common, leading to potentially costly business decisions.
  3. Limited Scalability: As businesses grew, the manual process couldn’t keep up, limiting the ability to process large datasets efficiently.

These challenges underscored the need for more sophisticated Business Intelligence services and tools.

The Rise of Automated BI Solutions 

An Automated BI solution represent a paradigm shift in data analysis. These systems, powered by artificial intelligence (AI) and machine learning (ML), offer a level of efficiency and accuracy unattainable by human analysts alone. A prime example is the adoption of Business Intelligence software by leading corporations, resulting in streamlined operations and data-driven strategies. Business Intelligence software vendors have made these tools more accessible, offering scalable solutions that cater to businesses of all sizes.

Comparative Analysis: Manual Data Analysis vs. Automated BI Solutions

The business intelligence landscape has been fundamentally reshaped by the transition from manual data analysis to automated BI solutions. This shift has brought into focus a comparative analysis of the two methodologies, highlighting their strengths, weaknesses, and the overall impact on business operations.

Efficiency and Speed

  • Manual Data Analysis: Consider a retail company manually tracking sales data. The process involves compiling data from different stores, which could take days or weeks, delaying critical decisions like restocking or promotions.
  • Automated BI Solutions: In contrast, using a BI solution, the same retail company could have real-time access to sales data across all stores. This immediate insight allows for swift decision-making, like instant restocking orders based on real-time sales trends.

Accuracy and Error Reduction

  • Manual Data Analysis: One of the major drawbacks of manual analysis is the susceptibility to human error, which can lead to inaccurate insights and costly mistakes. An example is a financial analyst manually compiling quarterly reports, where a simple misentry in a spreadsheet could lead to incorrect conclusions about financial health.
  • Automated BI Solutions: Automated BI services, on the other hand, minimize these errors. Business Intelligence software vendors have developed sophisticated algorithms that ensure high accuracy levels in data analysis, reducing the risk of errors significantly.

Scalability and Adaptability

  • Manual Data Analysis: Scaling manual data analysis processes as a business grows can be challenging, often requiring more personnel and resources, which isn't always feasible.
  • Automated BI Solutions: Automated BI solutions excel in scalability. As a business grows, these systems can easily handle an increasing amount of data without a proportional increase in effort or expense.

Cost Implications

  • Manual Data Analysis: A manufacturing company relying on manual data analysis might incur additional costs in labor for data entry and analysis, along with potential costs from delayed decisions due to slow data processing. 
  • Automated BI Solutions: Although implementing a BI solution may require a higher initial investment, particularly when working with leading Business Intelligence software vendors, the long-term ROI is usually higher due to increased efficiency, accuracy, and scalability.

Integration with Business Strategy

  • Manual Data Analysis: Manual analysis often operates in silos, making it challenging to integrate insights seamlessly into broader business strategies.
  • Automated BI Solutions: Automated BI services are designed to integrate with various business systems, ensuring that insights are readily available and actionable across different departments.

Is Manual Data Analysis Really Obsolete? 

It would be premature to declare manual data analysis obsolete. In specific scenarios, particularly where nuanced, qualitative analysis is required, the human touch remains valuable. The optimal approach often involves a synergy of both manual and automated methods. By integrating human insight with the efficiency of Business Intelligence services, businesses can leverage the best of both worlds.

Future Trends in Business Data Analysis 

Looking ahead, the evolution of BI is poised to accelerate. Emerging trends indicate a future where BI solutions become even more intelligent, predictive, and integrated into every facet of business operations. However, alongside these advancements, there is a growing need for robust data governance and ethical data handling practices. To stay ahead, businesses must not only invest in the latest Business Intelligence software but also cultivate a culture that values data literacy and ethical use of data.

Conclusion 

The transition from manual data analysis to automated BI solutions represents a major evolution in business strategy. Traditional methods, while foundational, are increasingly complemented and enhanced by advanced tools like Grow. Grow stands out in the Business Intelligence software landscape, not only by transcending the limitations of manual analysis but also by augmenting it with deeper, more comprehensive data insights. Its transparent pricing model, detailed in "Grow Pricing 2023 Capterra," ensures that businesses of all sizes can access these powerful capabilities without hidden costs.

Moreover, the precision, efficiency, and scalability provided by automated solutions like Grow are indispensable in today's fast-paced, data-centric business environment. By adopting these tools, businesses can navigate the complexities of data analysis more effectively, turning data into actionable insights with greater speed and accuracy.

To truly understand how Grow can revolutionize your business’s approach to data analysis, consider exploring its capabilities firsthand. We encourage you to take advantage of Grow 14-day complimentary demo. This no-obligation trial offers a practical glimpse into how Grow can seamlessly integrate with your existing operations, empowering your business to make data-driven decisions with confidence and clarity.

Try before buy?

Gravatar

Suppose you’re a marketing manager, and you have a critical meeting in less than 24 hours. You need to present the latest campaign results, and spreadsheets just won’t cut it. This is where the magic of a data visualization dashboard comes into play, transforming rows of data into a compelling visual story.

This blog will guide you through the process of creating your very first dashboard visualization, seamlessly and efficiently.

In the realm of business intelligence, data visualization dashboards are more than just tools; they are essential narratives that drive decision-making. Whether it’s tracking sales, monitoring website traffic, or understanding customer behavior, a well-crafted dashboard can highlight key metrics and trends that might otherwise be lost in the noise of raw data.

But how do you go from spreadsheets to a visually appealing, informative dashboard in less than a day? That's precisely what we'll explore. By the end of this blog, you'll not only grasp the basics of dashboard visualization but also be equipped to create your first data visualization dashboard. This guide is designed to streamline the process, ensuring that your journey into business intelligence data visualization is both rewarding and impactful.

So, buckle up and prepare to embark on a journey that will elevate your data presentation skills and enrich your decision-making process. Let's dive into the world of dashboard visualization, where data tells a story, and every insight is a stepping stone to success.

Let’s first see what Dashboard Visualization means

What is data visualization, and why does it matter in BI? Simply put, dashboard visualization is the graphical representation of information and data. By using visual elements like charts, graphs, and maps, dashboard visualizations provide an accessible way to see and understand trends, outliers, and patterns in data. In the context of BI, this means turning large volumes of data into meaningful insights that can drive business decisions.

Steps to Develop Your First Dashboard Visualization in Less Than A Day

Step #1: Preparing Your Data

The foundation of any effective data visualization dashboard lies in the quality of the data it represents. Start by identifying relevant data sources that align with your objectives. Ensure the data's accuracy and consistency, as this directly impacts the reliability of your dashboard. Utilize tools for data cleaning, like Excel or specialized software, to remove any inconsistencies or irrelevant data. Then, transform your data, using SQL or Python scripts, into a format suitable for visualization.

Step #2: Choosing the Right Visualization Tools

Selecting the right tools is crucial for efficient dashboard visualization. Popular tools like Grow, Tableau, Power BI, and Qlik offer different features that cater to varying needs. For instance, Grow is renowned for its user-friendly interface and afforadability, while Power BI provides deep integration with other Microsoft services. Consider factors like ease of use, compatibility with existing systems, and the specific visualization needs of your business.

Grow BI, for instance, offers an intuitive drag-and-drop interface, making it incredibly user-friendly for beginners. Its prebuilt templates serve as an excellent starting point, allowing you to create professional-looking dashboards without the need for extensive design experience. This ease of use is a significant advantage when you're learning the ropes of dashboard visualization.

Step #3: Designing Your Dashboard

A well-designed data visualization dashboard is both aesthetic and functional. Follow the principles of effective dashboard design: prioritize clarity, keep the design simple, and choose color schemes that enhance readability. The design should be user-centric, meaning it should be tailored to the needs and understanding of the end-user. Incorporate their feedback into the design to ensure it meets their needs.

Step #4: Building Your Dashboard

Building your first business intelligence data visualization dashboard can be a rewarding experience. Start by importing your data into your chosen tool. Then, select the types of charts or graphs that best represent your data. For instance, use line charts for trends over time or bar charts for comparisons. Remember, the goal is to make the data as easy to understand as possible, balancing visual appeal with practical functionality.

Step #5: Testing and Iterating

Testing is a critical step in dashboard development. Test the functionality of your dashboard and its effectiveness in conveying the intended message. Collect feedback from potential users and be open to making iterative changes. This process ensures that your data visualization dashboard remains relevant, accurate, and user-friendly.

Best Practices for Maintenance and Updates

Maintaining your dashboard visualization is key to its long-term usefulness. Regularly update the dashboard to reflect new data and trends. As you become more comfortable with dashboard creation, experiment with advanced features like adding interactive elements or incorporating real-time data.

Conclusion

Achieving the milestone of creating a dashboard visualization in under a day is not just a dream but a practical reality with proper preparation and the right tools, such as those offered by Grow. 

Grow BI emerges as a highly accessible tool for beginners venturing into the world of dashboard visualization. Its user-friendly interface, coupled with features like drag-and-drop design, prebuilt templates, real-time data updates, and customizable widgets, makes dashboard creation not just simpler but also more efficient. 

Whether you're a small business owner or part of a larger organization, Grow BI equips you with the tools to transform complex data into actionable insights. These advantages make Grow software a compelling choice for anyone looking to start their journey in business intelligence data visualization

Curious about how Grow can transform your data visualization journey? Explore Grow Cost & Reviews on Capterra. This small step could be the start of your journey towards mastering the art of dashboard visualization, a key to unlocking the full potential of your business data.

Gravatar

Like many other companies, do you find yourselves overwhelmed by the sheer volume of data you need to process and analyze? A significant number of employees, about 74%, report feeling overwhelmed or unhappy when working with data. This is further compounded by the fact that only 27% of business executives feel that their data and analytics projects produce actionable insights. These statistics highlight the critical need for effective data management and visualization tools like Grow Data Management Software

Grow addresses these challenges by offering intuitive, user-friendly dashboards and analytics tools, making it easier for businesses to harness their data for strategic decision-making. This approach is essential for businesses aiming to achieve market dominance in an increasingly data-centric world.

The Role of Data Management in Today's Business World

In an era where data is king, effective data management is the lifeblood of successful businesses. It's not just about collecting data but turning it into actionable intelligence. This is where the best Business Intelligence dashboards come into play. They transform raw data into a strategic asset, paving the way for informed decision-making and predictive analytics.

Case Studies: Top Companies Using Grow Data Management Software

  1. Hawkins Law Firm

The Hawkins Law Firm, specializing in personal injury and worker’s compensation in South Carolina, utilized Grow Data Management Software to overcome challenges in data utilization. Before Grow, the firm struggled with effectively visualizing and leveraging their extensive data. With Grow's implementation, they were able to efficiently track leads and case statuses, integrating data across various departments. The firm's use of 284 metrics and 35 dashboards showcases Grow's adaptability and effectiveness as a business intelligence tool, leading to improved operational efficiency and decision-making processes.

  1. RedShelf

RedShelf, an ebook provider for the education sector, faced challenges in managing scattered data across their vast digital content library. Implementing Grow Data Management Software, they were able to centralize and visualize critical data, such as revenue figures and sales pipelines. Grow's integration provided RedShelf with an accessible, transparent data visualization platform, enhancing decision-making and operational efficiency. The software's ability to combine multiple data sources into a single metric was particularly valuable, reducing queries and improving staff awareness about business operations. 

This transformation highlights Grow's status as a leading solution among Business Intelligence software vendors, offering some of the best Business Intelligence dashboards available.

  1. Dolls Kill

In the fashion e-commerce realm, Dolls Kill stands out for its strategic use of Grow Data Management Software, showcasing the software's capability as a tool offered by leading Business Intelligence software vendors. This integration facilitated real-time tracking of KPIs and metrics, significantly enhancing operational decision-making and team alignment, thereby contributing to Dolls Kill's expansion into new markets, including their venture into brick-and-mortar retail.

  1. ShipMonk

ShipMonk, an innovative fulfillment and inventory management solution, embraced Grow Data Management Software to streamline their data processes. Facing challenges with scattered, siloed data, ShipMonk found Grow's real-time data updates and comprehensive integrations crucial for efficient data visualization and reporting. This transformation underscores Grow's role as a top-tier solution among Business Intelligence software vendors, demonstrating its capability to offer the best dashboards software for diverse business needs.

For detailed information and specific examples, you can visit their success stories page directly at Grow Customers

Key Features of Grow Data Management Software

Grow Data Management Software distinguishes itself in the Business Intelligence landscape with its unique features, which contribute significantly to effective data analysis and decision-making.

Key Features:

  1. Real-Time Data Updates: Grow ensures that data is always current, enabling businesses to make timely decisions.

  2. Customizable Dashboards: Recognized as offering some of the best Business Intelligence dashboards, Grow allows users to tailor their data visualizations to meet specific needs.

  3. Comprehensive Integrations: Grow's ability to integrate with a wide range of data sources is a standout feature, making it a versatile choice among data management software.

Comparative Analysis: Compared to other data management tools, Grow's real-time updates and customizable dashboards position it as a more user-friendly and adaptable solution. While other tools may offer similar data integration capabilities, Grow's emphasis on user experience and ease of customization make it a preferred choice for businesses seeking an intuitive and effective BI tool.

These features collectively enhance Grow's appeal as a top solution among Business Intelligence software vendors, catering to businesses seeking efficient and insightful data management solutions.

Common challenges businesses face while implementing Grow

  1. Data Integration Complexity: Integrating various data sources can be complex.

  2. User Adoption: Staff may resist transitioning to a new system.

  3. Data Accuracy and Consistency: Ensuring data accuracy across different platforms.

Solutions and Best Practices to overcome these challenges

  1. Simplified Integration: Grow offers simplified integration processes, making it easier to amalgamate data from multiple sources.

  2. Training and Support: Providing comprehensive training and support helps in smooth user adoption.

  3. Regular Data Audits: Conducting regular audits ensures data accuracy and consistency.

Best Practices:

  1. Start Small: Begin with integrating a few key data sources and gradually expand.

  2. Engage Users Early: Involve staff in the implementation process to increase buy-in.

  3. Utilize Grow's Support: Leverage Grow's customer support for assistance with challenges.

Conclusion

In our journey exploring how top companies use Grow Data Management Software, we've uncovered its transformative role in data-driven business strategies. Grow has proven to be a game-changer for businesses across industries, from healthcare tech to eCommerce, providing a centralized, real-time view of critical data. This has enabled companies to make more informed decisions, streamline operations, and ultimately drive growth and market dominance.

As we wrap up, remember that Grow’s best dashboards software isn't just another tool. It's a pathway to unlocking the full potential of your data, helping you to gain a competitive edge in your market. Whether you're in a small startup or a large corporation, Grow's ability to provide a single source of truth can be the catalyst for your next big leap.

So, if you're looking to elevate your business through data-driven insights, consider Grow’s best Business Intelligence dashboards. Join the ranks of over 20,000 successful companies that have leveraged this powerful tool to transform their data into strategic assets. For more information on Grow and how it can revolutionize your data management, visit Grow's website.


To dive deeper into what Grow offers and how it can benefit your business, visit the Grow data dashboard on Trustradius.


Gravatar

Small businesses often find it challenging to allocate sufficient budget and resources for BI implementation, especially when faced with the need for data science experts and IT infrastructure. This hesitation is compounded by concerns over the necessity of expensive infrastructure investments and the effort required for effective adoption across the organization. 

Yet, with the advent of self-service analytics and cloud-based solutions, these challenges can be navigated more efficiently, allowing small businesses to harness the power of BI tools without major cash outlays.

Imagine embarking on a journey like Redshelf with Grow's BI reporting tools, where initial cost concerns are transformed into long-term strategic gains, offering detailed insights and operational efficiency that drive business growth. Let's explore this transformative potential and address the cost and ROI challenges head-on, leveraging the success story of Redshelf as a means for what your business can achieve with the right BI tools.

Understanding BI Reporting Tools

Definition and Core Functions

BI reporting tools are sophisticated software applications designed to extract, analyze, and present complex data in an understandable format. At their core, these tools transform raw data into actionable Business Intelligence reports, enabling business owners to make informed decisions. These BI reports are essential for tracking performance, understanding customer behavior, and identifying market trends.

Evolution of BI Tools in the Small Business Sector

Historically, BI reporting tools were a luxury reserved for larger corporations due to their high costs and complexity. However, the landscape has changed dramatically. Today, a variety of BI reporting tools are tailored for the unique needs and budgets of small businesses. This evolution has democratized data analytics, allowing small enterprises to harness the power of BI reports without the need for extensive resources.

The Cost Aspect of BI Reporting Tools

Direct Costs of BI Reporting Tools

The journey into Business Intelligence (BI) reporting begins with an examination of direct costs. These are the most apparent expenses and typically include:

  1. Acquisition or Subscription Fees: Most BI reporting tools operate on a subscription model, offering various tiers based on features and scalability. While some tools offer entry-level options suitable for small businesses, others might require a more significant investment. It’s crucial to analyze the feature set against the needs of your business to ensure you are not over-investing in unused features.
  2. Installation and Maintenance Costs: Beyond the initial purchase or subscription, there are costs associated with setting up and maintaining BI reporting tools. This includes hardware upgrades if needed, software installation, and ongoing maintenance fees. These costs can vary significantly based on the complexity of the tool and the existing IT infrastructure of the business.

Indirect Costs of Implementing BI Tools

The indirect costs, often overlooked, play a crucial role in the overall financial impact of implementing BI reporting tools:

  1. Training and Adaptation Period: Implementing a new BI system often requires training staff to utilize it effectively. This period of adaptation can also lead to reduced productivity as employees climb the learning curve.
  2. Potential Downtime During Integration: Integrating BI tools into existing systems can lead to temporary operational disruptions. This downtime, while often short-lived, can have a cost implication in terms of lost productivity and, in some cases, lost revenue.

Cost Comparison with Traditional Reporting Methods

Comparing the costs of BI reporting tools with traditional reporting methods is essential. Traditional methods, often manual and time-consuming, can seem less expensive at first glance. However, the hidden costs of manual processes – such as the time spent compiling reports, the potential for human error, and the lack of real-time data analysis – often make BI tools a more cost-effective solution in the long run.

Business Intelligence reports generated by BI tools offer greater accuracy, efficiency, and deeper insights than manual methods, leading to better-informed decision-making. This strategic advantage can translate into cost savings and revenue generation that far outweigh the initial investment in BI tools.

The Value Proposition of BI Tools for Small Businesses

Empowering Data-Driven Decision Making

  1. Informed Decisions with BI Reports: At the core of BI tools is the capability to turn data into actionable insights. Small businesses, often limited by resources, can immensely benefit from BI reports that provide a clear picture of their operations, market trends, and customer behavior. This shift from guesswork to data-driven strategies can be the difference between thriving and merely surviving in a competitive marketplace.
  2. Real-Time Analytics: Unlike traditional reporting methods, BI reporting tools offer real-time analytics. This immediacy means small businesses can respond swiftly to market changes, adjust strategies on the fly, and capitalize on opportunities as they arise.

Enhancing Efficiency and Productivity

  1. Streamlining Reporting Processes: One of the significant advantages of BI tools is the automation of data collection and reporting processes. This automation translates into time savings, allowing small business owners and their teams to focus on core business functions rather than spending hours on manual data processing.
  2. Reducing Errors: Manual data handling is prone to errors, which can be costly for any business. BI reporting tools minimize these risks, ensuring that the BI reports produced are accurate and reliable.

Creating a Competitive Edge

  1. Leveraging Advanced Analytics: Small businesses can utilize BI tools to perform complex analyses that were once the domain of larger corporations with dedicated data teams. This capability allows for a deeper understanding of the market and customer needs, enabling small businesses to compete more effectively.
  2. Customized BI Reports: The ability to customize reports to suit specific business needs is a significant advantage. BI tools allow for the creation of tailored BI reports that focus on the metrics most relevant to a small business, facilitating more targeted strategies.

Cost-Effective Growth and Scalability

  1. Scalability of BI Tools: As a business grows, its data analysis needs become more complex. BI tools are designed to grow with the business, providing scalable solutions that do not require constant reinvestment. Grow offers unlimited user license for ever-increasing volumes of data processing without any additional costs. 
  2. Long-Term Cost Savings: The efficiency and insights gained from BI reporting tools often lead to cost savings in other areas of the business, such as marketing, inventory management, and customer service.

Conclusion

For small businesses, the value proposition of BI reporting tools extends far beyond mere data analysis. When evaluating Grow's BI reporting tools, it's crucial to consider both the direct subscription and customization costs and the broader operational expenses, such as training and support. 

However, the true value of Grow lies in its efficiency gains, data-driven insights, and scalability, which often outweigh these costs. User feedback on various platforms like TrustRadius help understand Grow’s real-world effectiveness, revealing a tool that not only meets the immediate BI reporting needs of small businesses but also evolves with them. 

For those seeking to leverage the full potential of BI tools, exploring Grow's capabilities and user experiences, visit “Grow with Grow.com TrustRadius

Gravatar

Picture this: The Younique Foundation, once buried in complex spreadsheets, found a new path with Grow's Business Intelligence platform. It's became a game-changer for them. They transformed their way of working, making a huge difference in supporting women recovering from sexual abuse. This story isn't just about data; it's about how smartly using it can bring hope and change lives. 

So, if you ask what is Business Intelligence. It’s safe to say that it turns data into decisions, strategies into actions. Simply put, Business Intelligence is a technology-driven process for analyzing data, providing actionable information to help executives, managers, and other corporate end users make informed business decisions. 

So, let's dive in and see how BI tools are reshaping our world, inspired by The Younique Foundation's incredible journey. It's a clear signal: the time to harness data like never before is now.

The Rise of Data as a Key Resource

Historically, businesses relied on conventional methods for decision-making. However, with the advent of BI, the focus has shifted towards data-driven strategies. 

Take, for instance, a global retail chain that used BI to optimize its supply chain, resulting in a significant reduction in operational costs. This is how Business Intelligence technologies convert data into strategic assets.

Unpacking Business Intelligence: Tools, Techniques, and Processes

Business Intelligence is an umbrella term that includes various tools, techniques, and processes dedicated to transforming raw data into meaningful insights for business decision-making. Let's delve into the specifics:

1. Detailed Breakdown of BI Tools

  • Data Visualization Tools: These are essential in BI for converting complex data sets into graphical representations. They make data more accessible and understandable. For instance, a business intelligence dashboard is a data visualization tool that aggregates and displays key metrics and KPIs in real-time, allowing managers to make quick, informed decisions.

Streamline your strategy and surge ahead with Grow – your command center for real-time insights and market-leading agility.

  • Analytics Platforms: These platforms are the backbone of what business intelligence is all about. They analyze large amounts of data to uncover hidden patterns, correlations, and other insights. 

For example, Comapi's switch to the Grow platform showcases the essence of what business intelligence is all about. By implementing this analytics platform, they transformed their data handling from cumbersome spreadsheets to real-time, easy-to-understand dashboards. This move allowed them to quickly analyze vast amounts of data from various sources, uncover hidden patterns and insights, and make proactive business decisions. 

2. Techniques Used in BI

  • Predictive Analytics: This technique uses statistical algorithms and machine learning to identify the likelihood of future outcomes based on historical data. 

Suppose, a telecom company uses predictive analytics to identify customers likely to churn. They analyze call quality, billing issues, and customer service interactions to preemptively offer tailored solutions and retain customers.

  • Data Mining: Data mining involves exploring large data sets to find consistent patterns or systematic relationships between variables. It's a key part of business intelligence technologies, used for segmenting customers, detecting fraud, or identifying potential market opportunities.


  • Machine Learning: Machine learning in BI is about developing algorithms that can learn and make predictions or decisions based on data. This technique is necessary in modern Business Intelligence trends, where adaptive learning is used to improve the accuracy of insights derived from data continuously. 

The most common example is of banks using predictive analytics to assess loan default risks. By analyzing credit scores, repayment histories, and market trends, they make more informed lending decisions.

3. Process Flow: From Data Collection to Insight Generation

  1. Data Collection: 

This is the first stage, where data is gathered from various sources like internal databases, social media, IoT devices, etc. 

Utilizing Grow's comprehensive integration capabilities, data is seamlessly aggregated from a variety of sources including internal databases, social media, IoT devices, and more, offering a unified view of critical information.

Image Source

  1. Data Processing and Storage

The collected data is then cleaned, structured, and stored in data warehouses or lakes, making it ready for analysis. 

Grow simplifies the organization and structuring of collected data. With its robust processing power, data is efficiently cleaned and stored, ensuring it’s primed for analysis without the need for complex IT infrastructure.

  1. Data Analysis and Interpretation

Using various BI tools and techniques, this data is then analyzed to extract meaningful insights. This is where the business intelligence dashboard plays a critical role, providing a user-friendly interface to interact with complex data sets. 

Grow's BI tools come into play here, analyzing data with advanced techniques to draw out deep insights. The platform's user-friendly interface on the business intelligence dashboard allows for complex data interaction, making analysis both accessible and interpretable to all business users.

  1. Insight Generation and Decision Making: 

The final stage is where insights are translated into actionable business decisions or strategies. For instance, insights from a business intelligence dashboard might indicate a rising trend in a particular product category, prompting the marketing team to focus their efforts on that area. 

In the crucial phase of insight generation, Grow's dashboards enable businesses to identify trends and patterns, translating them into actionable strategies. For example, as with Altaworx, insights gleaned from Grow's dashboard revealed a best-selling product's low-profit margin, leading to a strategic shift towards promoting more profitable items — a move that significantly enhanced their revenue stream.

Conclusion

Business Intelligence technologies are challenging the status quo of decision-making with their cutting-edge predictive and proactive approach. From enhancing operational efficiency to predicting future trends, BI empowers businesses to harness the true potential of their data. As the landscape evolves, staying abreast of Business Intelligence trends and continuously optimizing BI strategies will be key to maintaining a competitive edge.

Why wait to transform your data into decisive power? Start with Grow’s 14-day free trial and explore the intuitive, customizable dashboards that make data analysis accessible and actionable for your dynamic business needs. 

And for added confidence, see how Grow stands out in the market by reading the latest Grow.com Reviews & Ratings 2023 on TrustRadius. It’s your time to leverage the power of Business Intelligence with Grow and make data-driven success a reality for your business.

Gravatar

The evolution of embedded analytics in Business Intelligence Dashboard software is a game-changer, fueled by groundbreaking advances in data science and technologies like AI, ML, and IoT. 


Going beyond mere charts, the BI Dashboard Software now embraces advanced features such as predictive analytics and computer vision, ushering in a new era of insights and possibilities. 


Furthermore, as businesses grapple with intricate data challenges and heightened digital competition, the demand for embedded analytics is on the rise. The Embedded Analytics Market Forecast report suggests a continuous growth trajectory. The global market, valued at USD 55.3 billion in 2022, is anticipated to steadily reach USD 180.5 billion by 2032, maintaining a consistent growth rate of 12.7% CAGR.


Now, let's delve deeper into the evolving landscape of embedded analytics.

Understanding of Embedded Analytics

Embedded analytics, as defined by Gartner, is a digital workplace capability that seamlessly integrates data and analytics into existing applications, such as BI Dashboard Software, allowing data analysis to occur within a user's natural workflow without the need to toggle to another application.


Within dashboard software, a subset of Business Intelligence Technologies, embedded analytics elevates functionality by:

  • Providing comprehensive and context-specific data for thorough analysis, utilizing tools like drill-downs, filters, and slicers.

  • Enabling advanced and predictive analytics, encompassing forecasting, what-if scenarios, and recommendations, to enhance decision-making.

  • Facilitating interactive and collaborative analytics through annotations, comments, and sharing for improved communication and feedback.

  • Backing actionable analytics with elements like alerts, triggers, and workflows to optimize and expedite execution.

Exploring Key Aspects of Embedded Analytics in Dashboard Software

  1. The Business Value of Embedded Analytics

  1. Enhancing Decision-Making

Embedded analytics in Full-Stack Business Intelligence Software enhances decision-making quality and speed by providing relevant insights within user tasks. 


For example, Sebo Marketing, a data-focused company, faced challenges in tracking effective actions before adopting Grow for automated data visualization. With Grow, they now easily access and analyze key data points in one centralized platform, making decision-making infinitely easier. 


The implementation of  Business Intelligence Dashboard Software has resulted in a 20% increase in efficiency, enabling Sebo to handle more clients with the same expenses while ensuring accountability and improved performance through data-driven insights.

  1. Improving User Engagement

Transforming data analysis into an intuitive, interactive experience, embedded analytics in dashboard software enhances user engagement and retention. A user-friendly BI Dashboard Software with features like natural language queries and data storytelling makes data exploration enjoyable. In line with this, a report by Logi Analytics highlights the significance of embedded analytics, with 84% of application teams acknowledging its critical role in overall revenue development

2. Technical Advancements Behind Embedded Analytics

  1. Cutting-Edge Technologies

Embedded analytics is getting better with Business Intelligence Technologies like:

  • AI and ML: Giving us advanced analytics, like understanding language, analyzing feelings, spotting anomalies, and making informed suggestions.

  • IoT: Using device connections to the internet for real-time analytics, including streaming data, location-based insights, and edge analytics.

  • Cloud: Offering on-demand access to computing resources online, making embedded analytics more scalable and flexible through cloud-based, serverless, and hybrid approaches.


  1.  Integration and Scalability

Integrating analytics seamlessly in Business Intelligence Dashboard Software while maintaining performance and security is a hurdle. Scalability adds complexity, necessitating efficient handling of dynamic business needs and large datasets. Strategic solutions are key to overcoming these challenges.

Best Practices:

  • APIs for Connectivity: Utilize APIs for standardized access to diverse data sources and services.

  • Microservices Architecture: Implement microservices to modularize and enhance agility in analytical capabilities.

  • Containerization: Use containers to deploy analytics in isolated environments, ensuring consistent performance.

Discover the capabilities with Grow—offering flexible, scalable embedded analytics. Easily connect to any data source, relish stunning visualizations, and craft seamless analytics experiences. Explore more on Grow Cost & Reviews Capterra. 

3. Embedded Analytics and Data Security

  1.  Ensuring Data Privacy and Compliance

Embedded analytics faces a critical challenge in handling sensitive data while complying with regulations like GDPR, CCPA, and ISO 27001. Adherence involves employing encryption to secure data at rest and in transit, masking data for privacy, and implementing robust data governance.

  1. Best Practices for Data Security

  • Data Minimization: Collect and use only essential data to reduce exposure and respect user privacy.

  • Data Backup: Store data copies separately to ensure availability and recovery, preventing loss or damage.

  • Data Testing: Validate data and its functionality to detect and correct errors, enhancing accuracy, reliability, and performance.


Grow,  a Full-Stack Business Intelligence Software, ensures compliance with regulations, implements data encryption and masking, and enhances data quality and performance optimization.


4. Embedded Analytics as a Competitive Edge

  1. Industry-Specific Applications

Embedded analytics adopts a personalized approach, avoiding a one-size-fits-all model. For instance, in healthcare, it supports real-time patient monitoring and assists in clinical decision-making. Shifting to finance, it becomes a tool for optimizing performance by offering insights into transactions and risk. In the retail sector, it enriches the customer experience with personalized insights into behavior and preferences. This adaptability of Business Intelligence Dashboard Software across diverse industries empowers businesses to stand out in their respective markets.


  1. Future Trends and Predictions

Embedded analytics, a dynamic domain within Business Intelligence Technologies, continually evolves in tandem with emerging technologies. Future trends include:


  • Augmented Analytics: Integrating AI and ML to streamline and enhance the data analytics process, providing users with more intelligent insights.

  • Conversational Analytics: Expanding embedded analytics using natural language processing, allowing users to interact with data through voice or text for a more intuitive experience.

  • Immersive Analytics: Advancing embedded analytics with virtual, augmented, and mixed reality, creating a visual and interactive environment for a deeper understanding of data.

Conclusion

Transform your Business Intelligence Dashboard Software and business apps with embedded analytics. Elevate user experience for seamless data access, analysis, and workflow actions. While enjoying benefits like enhanced decision-making and boosted user engagement, it's vital to address common challenges in embedded analytics implementation


Grow, your go-to platform for embedded analytics offers simplified data manipulation across multiple sources, SSL encryption for secure data handling, automated email reports for team alignment, unlimited real-time updates, 150+ instant integrations, versatile data exporting, expert onboarding support, and a library of pre-built reports. 


Moreover, Grow ensures compatibility with legacy systems, breaks down data silos and provides ongoing maintenance and updates for a seamless and future-proof analytics solution. 


So why wait? Start a free trial with Grow today.

Gravatar

"Top Business Intelligence software companies” or “most used Business Intelligence software” – a simple Google search using this query will likely lead you to a business intelligence software list compiled by various tech sites, or directly to the landing pages of Microsoft, Oracle, and Tableau. This is a testament to their towering presence in the industry.


Consider Microsoft's Power BI platform, which isn't just another tool in the market. It's a global phenomenon, with its user base expanding into the millions. This showcases its vast influence and reach in the BI sphere. And then there's Tableau, a synonym for state-of-the-art Business Intelligence data visualization, also commanding a user community in the millions, signifying its critical role in data analytics.


But what exactly sets these giants apart from the rest? It's not solely their vast number of users. Their continuous innovation, exceptional user experience, and the depth of insights they provide elevate them above others in the field. 

As we delve into this someBusiness Intelligence examples, we'll also consider an important question: Are these the only tools available, or are there viable alternatives to these well-established giants? 

Distinguishing Features of Superior BI Software 

Superior business intelligence software, developed by top-tier Business Intelligence software companies, is characterized by several distinguishing features:

  • Advanced Data Analytics Capabilities: The best BI tools offer sophisticated data analytics, enabling users to perform complex statistical analyses, predictive modeling, and trend analysis. This functionality is essential for deriving actionable insights from large datasets.

  • Seamless Integration and Scalability: High-caliber BI software can integrate seamlessly with existing systems and databases, supporting a variety of data formats. Scalability is key, ensuring that the software grows with the business and handles increasing volumes of data efficiently.

  • Real-Time Data Processing: In today’s fast-paced business environment, the ability to process and analyze data in real time is invaluable. This feature allows businesses to react swiftly to market changes and make informed decisions promptly.

  • User-Friendly Interface: Despite their complex functionalities, top BI tools are designed with user-friendly interfaces. This accessibility ensures that insights are not just limited to data scientists but are available to all business users, fostering a data-driven culture across the organization.

Spotlight on Leading BI Software Companies

1. Tableau: Pioneering Data Visualization 

Tableau has established itself as a frontrunner among Business Intelligence software companies, primarily due to its groundbreaking approach to data visualization. Here’s how Tableau stands out:

  • Intuitive Visual Discovery: Tableau’s interface is designed for intuitive data exploration. Users can easily drag and drop data elements to create visually compelling and interactive dashboards. This ease of use democratizes data analysis, making it accessible to non-technical users.

  • Robust Analytical Depth: Despite its user-friendly interface, Tableau does not compromise on analytical depth. It supports a range of analytical processes from basic to advanced, including predictive analytics, making it a versatile tool for a variety of Business Intelligence examples.

  • Vibrant Community and Extensive Resources: Tableau’s success is bolstered by its vibrant community and extensive resource library. This ecosystem enhances the overall utility and adoption of Tableau in diverse business environments.

Grow's Comparative Advantage: While Tableau excels in creating intricate visual analytics, Grow offers an equally intuitive platform but with a no-code approach, making advanced data visualization accessible to all business users, not just data analysts.

2. Microsoft Power BI: Integrating BI into Business Ecosystems 

Microsoft Power BI is another giant in the realm of Business Intelligence software companies. Its integration with the Microsoft ecosystem has been a game-changer in the field:

  • Seamless Integration with Microsoft Products: Power BI’s integration with Microsoft products like Excel, Azure, and Dynamics 365 offers a cohesive BI solution. This synergy allows for a streamlined flow of data across various applications, amplifying the Business Intelligence tools benefits.

  • Affordability and Scalability: Power BI is known for its affordability and scalability, making it an attractive option for small to large businesses. This accessibility has played a significant role in the widespread adoption of BI tools across various sectors.

  • Advanced Data Visualization Capabilities: Power BI’s advanced Business Intelligence data visualization capabilities have set new standards in the industry. Its ability to handle large datasets and produce real-time insights through engaging visuals has transformed how businesses interpret data.

Grow's Comparative Advantage: In contrast to Power BI’s broad ecosystem, Grow Business Intelligence tools benefits with a straightforward, transparent pricing structure, making it a more approachable and budget-friendly option for small and medium-sized businesses seeking efficient BI solutions. 

A key differentiator is Grow's unlimited user license model, which allows businesses of all sizes to scale their BI operations without worrying about increasing costs associated with additional user licenses.

3. SAS: The Power of Advanced Analytics 

SAS is one of the veterans in the field of business intelligence and analytics. Its BI software is renowned for:

  • Advanced Analytical Capabilities: SAS offers sophisticated analytical capabilities, including predictive analytics, machine learning, and AI integration. These features enable businesses to gain deep insights and forecast future trends.

  • Customization and Flexibility: SAS provides highly customizable solutions that can be tailored to specific industry needs. This flexibility makes it a preferred choice for complex Business Intelligence examples in sectors like finance and healthcare.

  • Commitment to Data Security: SAS places a strong emphasis on data security and governance, ensuring that sensitive business data is handled securely, which is a critical aspect of BI tools.

Grow's Comparative Advantage: While SAS offers depth in analytics, Grow strikes a balance between sophisticated analysis and user-friendliness, catering to businesses that need advanced insights without the complexity often associated with high-end BI tools.

4. Oracle: Integrating BI with Enterprise Solutions 

Oracle is another key player, known for integrating business intelligence with broader enterprise solutions. Key highlights include:

  • Comprehensive Enterprise Suite: Oracle's BI tools are part of a comprehensive suite of enterprise applications, offering seamless integration with CRM, ERP, and SCM systems. This integration provides a holistic view of business operations.

  • Cloud-Based Solutions: Oracle has been a pioneer in offering cloud-based BI solutions, enhancing accessibility, and reducing the infrastructure costs associated with business intelligence tools.

  • Diverse Data Visualization Tools: Oracle BI includes a range of Business Intelligence data visualization tools, helping businesses transform complex datasets into understandable and actionable insights.

Grow's Comparative Advantage: Grow stands out with its focused and agile BI solutions, perfect for businesses looking for potent yet uncomplicated tools that provide quick insights and easy adaptability in a fast-paced business environment.

5. Qlik: Emphasizing User-Driven Data Discovery 

Qlik has carved out a niche in the BI market with its user-centric approach to data discovery and Business Intelligence data visualization. Its strengths are:

  • Associative Data Modeling: Qlik's unique associative data model allows users to explore data connections in a more intuitive way, enhancing the Business Intelligence tools benefits.

  • Agile and Flexible Data Integration: Qlik offers agile and flexible solutions that adapt to different business environments, facilitating a more responsive approach to data analysis.

  • Engaging and Interactive Visualizations: Qlik’s focus on creating engaging and interactive Business Intelligence data visualization has made it a popular choice among businesses seeking to democratize data analysis.

Grow's Comparative Advantage: Similar to Qlik, Grow emphasizes intuitive data exploration but goes a step further by offering a no-code platform, making it an ideal choice for companies that prioritize ease of use and rapid deployment of BI solutions.

Conclusion

Discover the Grow Difference in Business Intelligence

In the competitive landscape of business intelligence, Grow presents itself as a viable alternative to Business Intelligence software companies like Tableau, Microsoft Power BI, and others. It distinguishes itself with transparent pricing, removing the guesswork and complexity often associated with BI tool costs. 

Grow's intuitive, no-code functionality empowers both technical and non-technical users, simplifying data analytics without compromising on depth. Its advanced analytics capabilities cater to sophisticated data needs while maintaining user-friendliness. 

For a closer look at how Grow aligns with your business needs, explore "Grow Reviews Cost & Features on GetApp.

Gravatar

Successful marketing demands constant innovation and a clear understanding of customers, competitors, and performance. Marketing Dashboards, visual tools displaying key data, provide the solution by enabling real-time monitoring, analysis, and optimization of strategies, fostering effective stakeholder communication.

For example, facing data scatter as Edit Suits Co. expanded, Grow's BI Dashboard Software proved transformative. The 'Force' executive dashboard links marketing to sales, tracks costs, and streamlines inventory. With unlimited users and scalability, Grow ensures live reactions, proactive customer service, and future-proof business growth.

In this blog, we will discuss a step-by-step guide to implementing these Marketing Dashboards to optimize your marketing efforts effectively. 

But before delving in, let's look at the basics of dashboard analytics in marketing.

Understanding Dashboard Analytics in Marketing

Dashboard analytics are interactive, user-friendly tools that track and compare marketing aspects like website traffic, social media engagement, and ROI. Accessible on any device and updated in an instant, these customizable tools provide insights for effective marketing decision-making.

How To Implement Dashboard Analytics in Marketing Efforts

  1. Understanding Dashboard Analytics

Getting the hang of Dashboard Analytics is like stepping into the marketing world and figuring out where it fits. Start by asking yourself what you want to achieve with your marketing – your goals. Look at the numbers that really show how you're doing, like KPIs and other metrics. 

Think about where your info is coming from and what tools you're using. And don't forget about the people who care about your results – your stakeholders and audience. By tackling these questions, you're drawing a map showing how the Marketing Reporting Dashboard helps you reach your marketing goals.

  1. Pre-Integration Considerations

The next step is to prepare dashboard analytics for your marketing game plan; pay attention to a few important things:


  1. Data quality and reliability: 

Embark on effective Data Quality Management to ensure your data is right, complete, and useful. Rigorously check its origin to eliminate mistakes or biases, establishing a foundation of reliable information.


  1. Dashboard alignment: 

Your BI Dashboard Software should fit with what you and your business want. Make it easy to use and understand, showing the important stuff about how your marketing is doing.


  1. Dashboard customization: 

Customize your Dashboard Visualization to fit your needs and style. It should be flexible, so you can change it when your data or plans change.


Think about these things, and you'll be ready to smoothly add dashboard analytics to optimize your marketing efforts.


  1. Integration Process

Executing the integration of dashboard analytics into your marketing strategy involves several key tasks:


  1. Dashboard Selection: 

Choose the right BI Dashboard Software and platforms that align with your data, analysis, and visualization needs. Options like Grow, Tableau, Power BI, or Excel provide flexibility based on your budget, expertise, and preferences. Opt for Grow for a cost-effective and user-friendly solution, or consider Tableau or Power BI for a more robust approach.


  1. Dashboard Customization: 

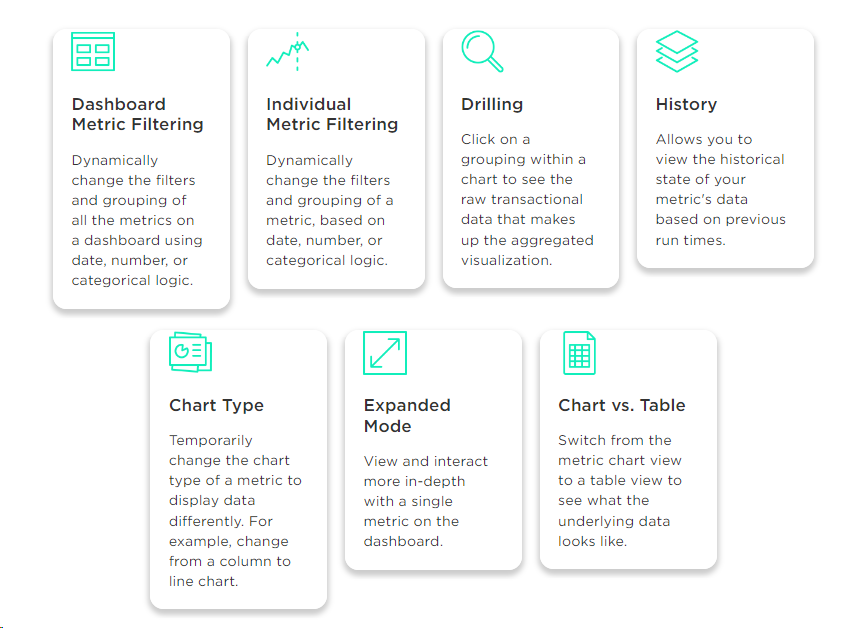
Personalize your Marketing Reporting Dashboard to display the necessary data effectively. Utilize features such as filters, segments, charts, graphs, and tables to craft a tailored dashboard that meets your specific requirements.


  1. Dashboard Adoption: 

Ensure team and stakeholder engagement by promoting the use and benefits of your dashboard. Provide tutorials, guides, and best practices to help them navigate and comprehend the Marketing Dashboards, fostering a data-driven culture within your organization.


By performing these tasks, you will be able to execute a successful integration of dashboard analytics to optimize your marketing efforts.

  1. Strategy Development Using Analytics

Dashboard analytics can be used to create and enhance your marketing tactics once you've incorporated them into your campaigns. 


Here are some examples of how dashboard analytics can help you to optimize your marketing efforts:


  1. Real-Time Insight Utilization:

Capitalize on the instantaneous data provided by Marketing Dashboards. Monitor key metrics such as visitor counts, lead generation, conversions, and revenue in real-time. Use this information to assess and adapt your marketing initiatives promptly.


  1. Dynamic Copy Refinement:

Should you observe underwhelming performance in ad engagement, swiftly modify ad copy, headlines, or calls to action. This agility allows for rapid optimization of click-through and conversion rates.


  1. Responsive User Experience Enhancement:

Crafted with accessibility in mind, the BI dashboard software ensures a user-friendly experience for individuals with disabilities. Through analytics-driven insights, you can identify and swiftly address areas for improvement in website, landing page, or blog performance, enhancing overall engagement and satisfaction for all users.


  1. Employing Predictive Analysis :

Use historical and current data with analytical techniques like regression and forecasting to predict future trends. Anticipate opportunities and threats, estimate future demand, and project performance for realistic goal setting.

  1. Evaluating and Adjusting Marketing Strategies

Regularly assess and refine your marketing strategies;dashboard analytics is an ongoing tool, not a one-time fix. Sustained evaluation and adjustments are crucial for ensuring optimal results and insights. 


Here are practical steps to effectively evaluate and refine your Marketing Reporting Dashboard:


  1. Consistent Metric Tracking:

Continuously monitor and analyze performance metrics to gauge progress and success. Identify any gaps or issues in your marketing efforts through thorough measurement.


  1. Implement Feedback Loops:

Establish a feedback system within your Marketing Dashboards to gather insights from customers, team members, and stakeholders. Utilize this valuable input to fine-tune and enhance your marketing strategies based on their perspectives and suggestions.


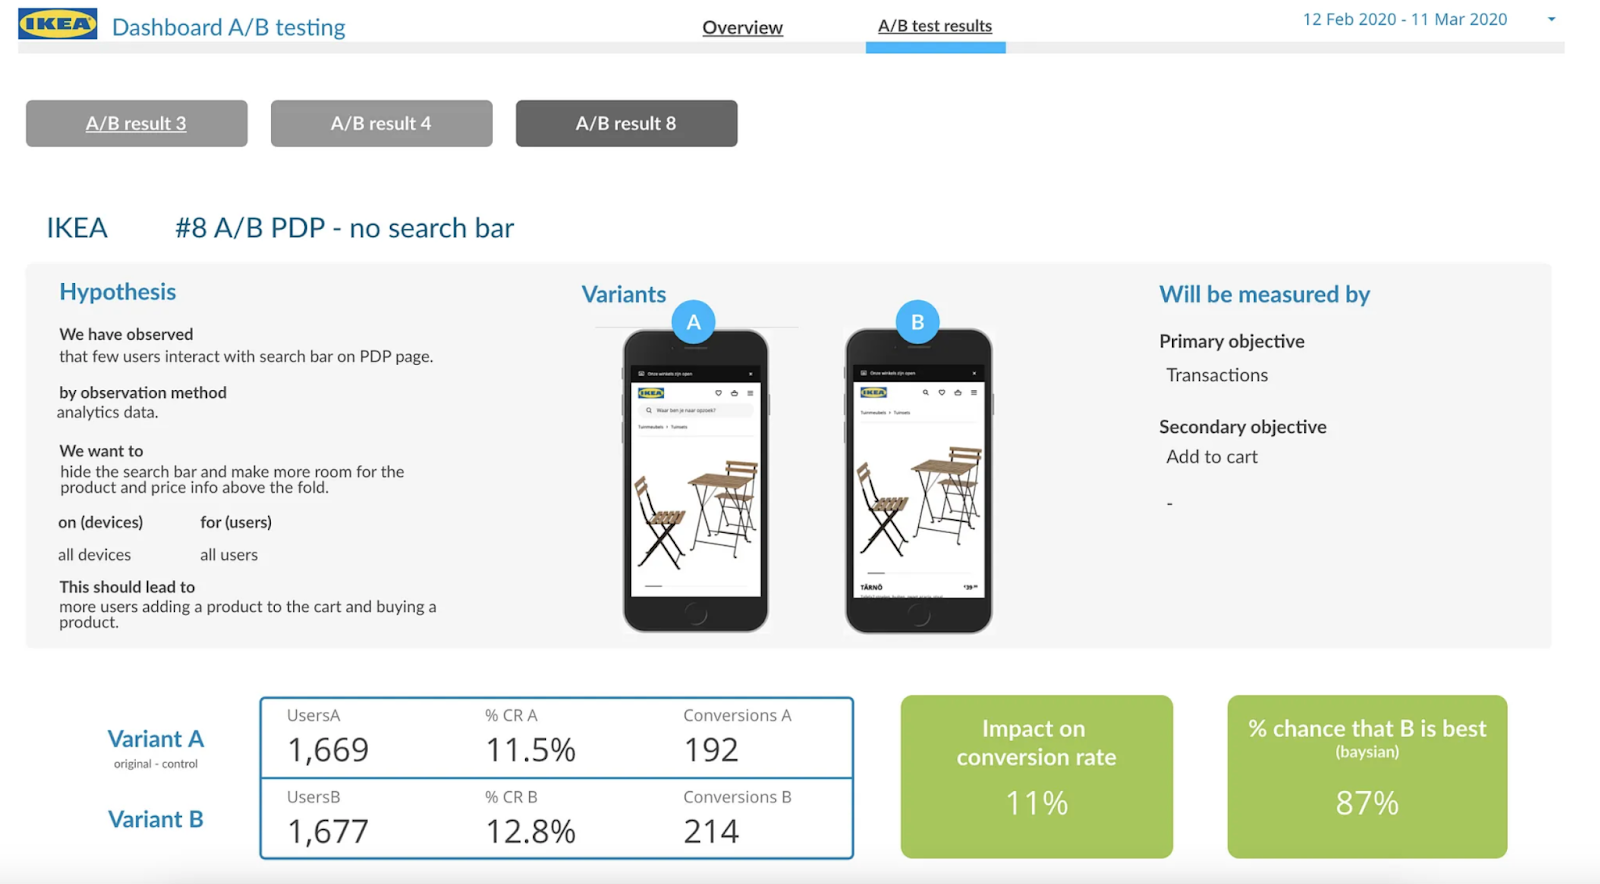
  1. A/B Testing for Optimization:

Engage in A/B testing by experimenting with different versions of marketing campaigns, such as ad copy, landing pages, or email subject lines. Leverage Marketing Reporting Dashboard insights to compare and contrast performance, determine which variations yield superior results, and understand the reasons behind their effectiveness.


  1. Addressing Challenges


While dashboard analytics provide significant insights, they also provide their own set of issues that must be carefully considered and resolved to optimize your marketing efforts.


Here are some prevalent challenges and strategies to address them:


  1. Handle Data Overload Effectively:

Manage data abundance by focusing on key metrics, preventing overwhelm or distraction from irrelevant information. Prioritize crucial metrics aligned with your marketing goals. 


  1. Ensure Seamless System Integration:

Guarantee a smooth integration with other systems to avoid compatibility issues. It's essential that your dashboard analytics seamlessly collaborate with other data sources and tools like CRM, ERP, or CMS.


  1. Prioritize Stringent Data Security Measures:

Uphold robust data security measures to safeguard against unauthorized access, use, or disclosure. Comply with legal and ethical regulations such as GDPR, CCPA, or HIPAA to ensure the privacy and integrity of your data. You can find all the capabilities in Grow, a reliable BI Dashboard Software with compatible and secure features.


Check Grow Reviews from Verified Users Capterra before making decisions.

Conclusion

Elevate your marketing with Marketing Reporting Dashboard. Monitor and optimize in real-time, personalize campaigns, predict trends, and refine strategies effortlessly. Overcome challenges with Grow, a tailored Dashboard Visualization solution offering customizable dashboards, real-time analytics, and seamless integration for empowered marketing control.


Optimize marketing with a free trial of Dashboard Analytics. Experience the powerful impact on efficiency and success firsthand. 

Gravatar

Data quality in Business Intelligence reporting tools refers to the accuracy, completeness, consistency, and reliability of data. These dimensions are paramount in ensuring that the insights derived from a Business Intelligence reporting suite are sound and actionable. 


Industry leaders emphasize that the credibility of any BI reporting tool hinges on the quality of its data. For instance, a Gartner study highlighted that poor data quality is a primary reason for 40% of all business initiatives failing to achieve their targeted benefits.

Common Challenges in Maintaining Data Quality 

1. Inconsistent Data Sources 

One of the primary challenges in maintaining data quality in a Business Intelligence tool is managing inconsistencies from various data sources. Companies often gather data from disparate sources, each with its format, quality, and accuracy. For example, when a multinational corporation integrates data from different regional offices into its central BI reporting suite, inconsistencies in data formats and units can lead to significant discrepancies in reports.

Solution: Implementing standardized data integration protocols and using a robust BI reporting tool that can normalize data from diverse sources is essential.

2. Data Duplication 

Duplication is a common issue in BI reporting tools. It arises when the same data points are entered multiple times, leading to redundancy and confusion. For instance, in a sales database, the same customer might be entered multiple times with slight variations in name or contact details, causing confusion in sales analysis.

Solution: Regular data audits and employing deduplication tools within the Business Intelligence reporting suite can significantly reduce redundancies.

3. Outdated Information 

In the dynamic business environment, data becomes outdated rapidly. A BI reporting tool relying on old data can lead to misguided strategies. For example, a retail company using outdated customer preference data in its Business Intelligence reporting suite may end up stocking products that are no longer in demand.

Solution: Establishing protocols for regular updates and real-time data processing in the Business Intelligence tool can keep information relevant and timely.

4. Poor Data Quality at Source 

The adage 'garbage in, garbage out' is particularly apt for BI reporting tools. Poor data quality at the source can compromise the entire BI process. This issue is often seen in manual data entry processes where human error can lead to inaccuracies.

Solution: Implementing automated data collection methods and rigorous initial data quality checks can enhance the overall quality of data in the Business Intelligence reporting suite.

5. Lack of Comprehensive Data Governance 

Without a robust data governance framework, maintaining data quality in BI tools can be challenging. Data governance involves policies, procedures, and standards for data management. A lack of these can lead to unstructured and ungoverned data usage, affecting the quality of outputs from BI reporting tools.

Solution: Developing a strong data governance framework that encompasses all aspects of data management, from collection to reporting in the Business Intelligence tool, is vital.

Best Practices for Ensuring Data Quality 


1. Establishing a Strong Data Governance Framework 

The first step in ensuring data quality in any Business Intelligence tool is to establish robust data governance. This involves setting clear policies and standards for data management. For instance, a financial institution might implement stringent data entry norms to ensure accuracy in its BI reporting tools. This governance framework should define who is accountable for various data-related tasks and establish clear procedures for data handling.

2. Implementing Automated Data Validation and Cleansing 

Manual data handling is prone to errors. Incorporating automated data validation and cleansing processes in your Business Intelligence reporting suite can drastically reduce inaccuracies. Automation can identify and correct errors, like inconsistencies in customer data, which often plague manual entries in BI reporting tools. Tools like SQL Server Data Quality Services or Oracle Data Quality can be integrated into your Business Intelligence reporting suite for this purpose.

For more insights on efficient data management and the use of advanced tools, read our detailed blog Clean, Combine, and Conquer: Data Management Made Easy with Grow BI.

3. Regular Data Audits 

Regular data audits are crucial for maintaining the integrity of data in Business Intelligence tools. These audits involve systematically reviewing and validating the data to ensure it meets the required quality standards. For example, a retail company might perform quarterly audits on its customer data within its BI reporting tools to ensure accuracy and consistency.

For a detailed guide on conducting these audits effectively, refer to our comprehensive article on How To Audit Your Current BI Reporting System, which provides step-by-step instructions and best practices.

4. Ensuring Data Completeness 

Incomplete data can lead to erroneous conclusions in BI reporting. Best practices dictate that all necessary fields in your Business Intelligence tool should be completed to provide a comprehensive picture. For instance, ensuring all customer interactions are logged and tracked in the Business Intelligence reporting suite enables more accurate customer behavior analysis.

5. Emphasizing Data Accuracy at the Source 

The quality of data in BI reporting tools is only as good as the quality of data at the source. It’s crucial to ensure that the data entering your Business Intelligence reporting suite is accurate. This might involve training staff on the importance of accurate data entry or using technology to capture data directly from its source, thereby reducing the likelihood of human error.

6. Utilizing Advanced Technologies 

Leveraging advanced technologies such as AI and machine learning can further enhance data quality in Business Intelligence reporting tools. These technologies can predict and rectify data anomalies and provide insights into data quality issues that might not be evident to the human eye.

7. Fostering a Culture of Data Quality Awareness 

Creating a culture where every team member understands the importance of data quality in the Business Intelligence reporting suite is critical. Training and awareness programs can help staff understand how their role impacts the overall data quality in BI tools.

Advanced Techniques and Technologies in Data Quality Management 

Artificial Intelligence (AI) and machine learning are revolutionizing data quality management in BI reporting tools. Data governance also plays a crucial role. An interview with a data scientist revealed how AI algorithms could predict and rectify data anomalies in a BI reporting suite.


Powerblanket, a Utah-based company specializing in freeform heating products, faced financial challenges in 2013 due to outdated spreadsheet methods. Implementing Grow's real-time reporting transformed their workflow, significantly reducing time spent on financial documents. With Grow dashboards, they enhanced employee engagement and performance by making data accessible and visible throughout their plant. This democratization of data and streamlined reporting contributed to Powerblanket's recognition in manufacturing excellence, demonstrating Grow's impact on their efficiency and productivity.

Measuring and Monitoring Data Quality 

Key performance indicators for data quality include accuracy, completeness, and timeliness. Establishing a culture that prioritizes data quality, where every team member understands their role in maintaining the integrity of the Business Intelligence tool, is essential.

Implementing a Data Quality Framework in Your Organization 

Developing a data quality framework for your Business Intelligence tool involves a clear understanding of your data requirements and the implementation of stringent data governance policies. Training your team to recognize the importance of data quality in BI reporting tools is crucial for sustained success.

Conclusion

Elevate Your Data with Grow BI

In summary, we have highlighted the crucial role of data quality in BI success. A key tool to achieve this is the Grow BI dashboard, known for its ease of use and advanced analytics. 

For a deeper understanding of its transformative impact, check out "Grow reviews 2023." Plus, don't miss our guide "Clean, Combine, and Conquer: Data Management Made Easy with Grow BI" for practical tips on efficient data management.

Discover how Grow Free Demo can transform your data management and decision-making.


Gravatar

Imagine walking into your office on a Monday morning, coffee in hand, only to find your team in a state of confusion. Sales numbers have unexpectedly plummeted, but no one noticed until it was too late. 

The team is scrambling, trying to piece together data from different sources, but with no central platform for collaboration, the process is slow and chaotic. Decisions are being made in silos, based on incomplete information, leading to ineffective and delayed responses. 

This scenario is all too common in companies lacking three critical functionalities in their decision-making process: Alert, Collaborate, and Decide. 

Without any dashboard tool, companies in today's fast-paced business environment risk losing opportunities and making bad decisions. Our blog dives into how the right dashboard tools can change the game. 

We'll show you how these business dashboard software and tools help teams stay on top of important data, work together better, and make smart decisions quickly. So, let's explore how to turn a confusing pile of data into clear, effective decision-making.

Understanding Decision Support Systems 

Decision Support Systems have transformed from basic data representation models to sophisticated business intelligence dashboards. These systems are no longer luxuries but necessities in the data-driven business world. They provide critical data insights, aiding businesses in navigating through complex market dynamics.


The Role of Dashboards in Decision-Making 

Business intelligence dashboards are at the forefront of this evolution. They don't just display data; they bring it to life. These dashboards provide teams with real-time data visualization, enabling quick comprehension of complex information, which is essential for prompt decision-making.

  1. Alerting Mechanisms: Proactive Notifications and Automated Alerts

- Purpose and Importance: The alerting mechanisms in a business intelligence dashboard are crucial for timely decision-making. By providing proactive notifications and automated alerts, these tools ensure that key decision-makers are immediately informed about critical data changes or milestones.

-Implementation and Impact: An effective dashboard tool uses sophisticated algorithms to monitor data trends and trigger alerts based on predefined criteria. This can include significant sales drops, inventory shortages, or any other business-specific indicators. The impact of this feature lies in its ability to prevent oversight of critical issues, allowing for swift action.

-Advanced Capabilities: The best business intelligence dashboards take alerting further by integrating predictive analytics. This allows for alerts not just on current data but also on forecasted trends, providing an anticipatory approach to decision-making.

  1. Collaboration Functions: Sharing, Commenting, and Cooperative Analysis Features

-Role in Team Environments: Collaboration functions are a cornerstone of modern business intelligence dashboards. They enable team members to share insights, comment on findings, and engage in cooperative analysis directly within the dashboard environment.

-Enhancing Decision-Making Processes: These features break down silos in data analysis, allowing for a more democratic and inclusive decision-making process. By enabling multiple perspectives to converge on the same data set, they ensure a more rounded and thoroughly vetted decision-making approach.

Edit Suits Co., with their team spread across different locations, faced challenges with scattered data. By implementing Grow, they established a collaborative environment, enhancing decision-making and data management across the board.

-Technological Integration: The best dashboard tool incorporates advanced collaboration tools such as real-time commenting, shared dashboards, and version control, making them not just tools for data visualization but platforms for teamwork and joint decision-making.

  1. Decision-Making: Data Visualization Tools and Predictive Analytics

-Data Visualization Tools: The heart of any business intelligence dashboard is its data visualization capability. These tools transform complex datasets into understandable and actionable visual formats like graphs, charts, and heat maps, making it easier to identify trends and anomalies.

-Predictive Analytics for Forward-Looking Insights: Predictive analytics in these dashboards use historical data to forecast future trends. This feature is invaluable for long-term planning and risk management, as it provides businesses with a glimpse into potential future scenarios.

-Enhancing Strategic Decisions: By combining data visualization with predictive analytics, these dashboards empower businesses to not only understand their current state but also to anticipate future conditions. This dual capability is what sets apart the best business intelligence dashboards, making them powerful tools for strategic decision-making.

For example, Comapi's integration of various data sources into Grow's dashboards enabled them to focus on activities driving growth, while Redshelf used Grow to unify their data and empower their team with actionable insights.

Conclusion

The strategic integration of Grow's dashboard tools marks a shift in how businesses manage and interpret their data. With features such as real-time data integration, customized reporting, and interactive data visualization, Grow transforms the overwhelming complexity of data into a clear, actionable asset. Its advanced analytical capabilities, including AI-driven predictive analytics, provide businesses with foresight, allowing them to anticipate market trends and customer needs effectively.


Moreover, Grow's emphasis on collaboration brings a new dimension to team-based decision-making. With functionalities like shared dashboards and seamless communication tools, it breaks down silos within organizations, fostering a culture of informed, collective decision-making.


Grow's platform is not just about presenting data; it's about empowering businesses with the tools to navigate through data-driven challenges efficiently. 


For those seeking first-hand accounts of how Grow stands out in the market, a wealth of Grow Reviews from Verified Users Capterra offers insights into its practical applications and benefits across various industries. 


Ready to experience the transformation for yourself? 


Start Your 14-Day Free Trial with Grow!