Business Intelligence (BI) has long been the domain of data analysts and IT professionals, wielding complex tools to mine, analyze, and report data.
However, the rise of a no-code BI solution, such as Grow, is challenging this status quo.
This blog explores how no-code Business Intelligence tools are democratizing data analytics, making it accessible to all organizational levels, and fostering a data-driven culture across industries.
Historical Overview of BI
Historically, BI was synonymous with complex data warehouses, intricate queries, and reports that only IT professionals and data analysts could decipher and manage. This specialization made BI a "gate-kept" function within organizations, with a select few holding the keys to data-driven insights. The process was not only time-consuming but also limited the agility with which businesses could respond to market changes. As such, BI's potential impact was restricted by these technical barriers, creating silos and hindering cross-departmental collaboration.
The Advent of No-Code Solutions
No-Code BI (Business Intelligence) Platforms
No-code BI platforms represent a holistic approach to Business Intelligence. They are comprehensive solutions designed to facilitate the entire BI process, including data integration, analysis, and reporting, without requiring users to write code. These platforms are characterized by:
- Intuitive Interfaces: User-friendly dashboards that allow users to interact with their data effortlessly.
- Drag-and-Drop Functionalities: Tools for creating complex reports and dashboards through simple, intuitive actions.
- Simplified Data Modeling Processes: Features that enable users to define relationships between different data sets easily, enhancing the depth of analysis.
A No-code BI solution is designed with the end-user in mind, significantly lowering the barrier to entry for engaging with BI tools. They allow people without programming abilities to do sophisticated data analysis and visualization activities, making informed decisions available at all organizational levels.
No-Code Analytics
No-code data analytics focuses specifically on the analytical component of the BI process. It allows users to:
- Analyze Data Without Coding: Users can explore data sets, perform statistical analyses, and generate insights using intuitive tools that don't require programming knowledge.
- Visualize Insights: Although closely related to no-code data visualization, in this context, the emphasis is on the analytical output—transforming data into understandable formats that inform decisions.
No-code data analytics platforms are essential for empowering business users, managers, and decision-makers to independently access and analyze data, streamlining the decision-making process across various functions like marketing, sales, HR, and operations.
No-Code Visualization
No-code visualization refers more specifically to the tools and features that focus on the visual representation of data. This aspect includes:
- Creating Visual Dashboards and Reports: Tools that enable users to drag and drop data points and metrics into graphical formats like charts, graphs, and maps.
- Interactive Elements: Features that allow end-users to interact with the data visualizations, such as filtering data or drilling down into more detailed views.
While no-code visualization is a critical component of both no-code BI platforms and no-code data analytics tools, its specific focus is on making the presentation of data insights as accessible and understandable as possible, irrespective of the user's technical background.
Impact and Adoption of No-Code BI
The impact of the no-code BI solution on the business landscape has been profound. According to a recent survey by Gartner, organizations that have adopted no-code BI tools report a 40% reduction in the time taken to derive insights from data, highlighting the efficiency gains associated with these platforms.
Breaking Down the Barriers: How No-Code BI Empowers Everyone
Challenges Posed by Traditional BI Tools
Historically, traditional BI tools have been complex and technical, requiring users to have specific skills in data processing, statistical analysis, and programming. This complexity presented several barriers to non-analysts:
- Technical Proficiency: Traditional BI required a deep understanding of databases, query languages (like SQL), and data science principles, limiting its use to IT professionals and data analysts.
- Cost and Time Constraints: The development and maintenance of custom BI solutions were often costly and time-consuming, diverting resources from other business areas.
- Data Silos: The technical nature of traditional BI tools often resulted in data silos, where data was accessible only to specific departments, hindering organization-wide insights and collaboration.
How No-Code BI Solutions Remove These Barriers
No-code BI solutions have emerged as a powerful tool to overcome these challenges by simplifying data integration, analysis, and visualization processes:
-
Simplifying Data Integration
Advanced Data Connectors and APIs: No-code BI platforms often come equipped with a wide array of pre-built data connectors and APIs that facilitate seamless integration with various data sources, including cloud storage solutions, SaaS platforms, and on-premises databases. This range of connectors ensures that users can easily bring together data from disparate sources, enabling a holistic view of business operations without the need for complex scripting or manual data wrangling.
Automated Data Preparation: Beyond simple connections, these platforms offer advanced features for automated data preparation. This includes auto-detection of data types and relationships, intelligent data cleansing functions, and automated transformation processes (like joining tables and aggregating data). Such features significantly reduce the time and expertise required to prepare data for analysis, making it faster and easier for users to move from data collection to insight generation.
-
Democratizing Data Analysis and Visualization
AI-Powered Insights: To further democratize data analysis, many no-code BI platforms leverage AI and machine learning algorithms to automatically surface insights and trends. Users can benefit from features like predictive analytics, anomaly detection, and natural language processing (NLP) for querying data. These AI-driven capabilities allow users to uncover deeper insights without needing advanced statistical knowledge.
Complex Data Modeling Made Simple: Even without traditional coding skills, users can perform sophisticated data modeling thanks to intuitive visual interfaces. These interfaces enable the creation of complex data models—such as cohort analyses, customer lifetime value calculations, and segmentation—through simple, user-friendly processes. This capability ensures that users can conduct in-depth analyses that were once the purview of data scientists.
Also read, 10 Ways To Make Your Data Modeling Better
-
Facilitating Collaboration
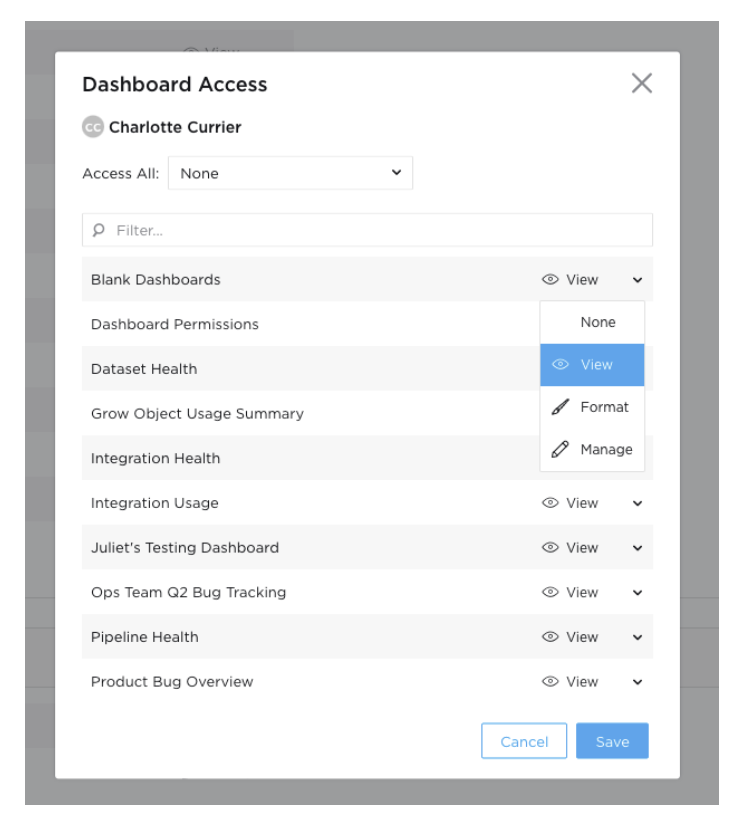
Real-Time Data Sharing and Permissions: No-code BI platforms enhance collaboration not just by making data accessible but also by enabling real-time data sharing and management of access permissions. This ensures that the right people have the right level of access to insights, fostering a secure yet collaborative data culture.

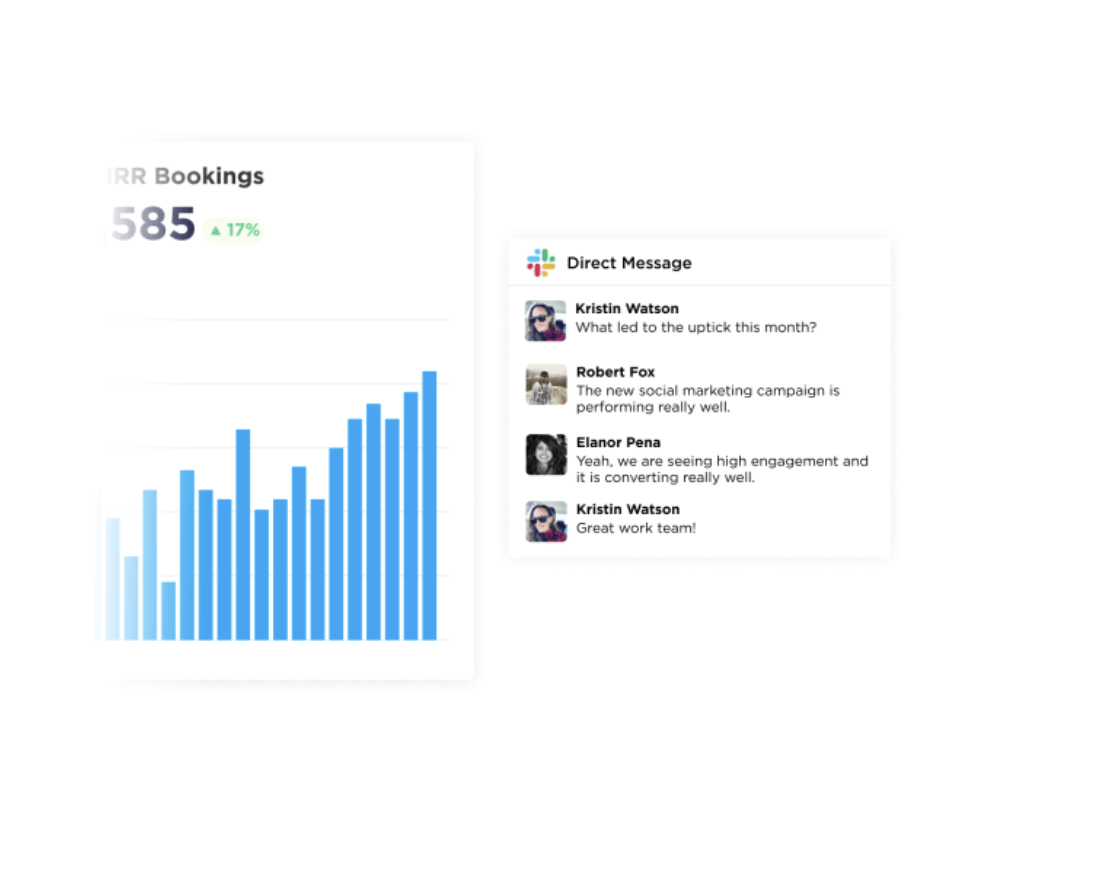
Interactive Dashboards and Reports: The ability to create interactive dashboards and reports that can be easily shared across the organization or with external stakeholders is another critical feature. Users can drill down into metrics, explore data through various visualizations, and even perform ad-hoc queries within these shared resources, making the collaborative process more dynamic and insightful.

-
Expanding Accessibility of Insights
Mobile Accessibility: Recognizing the need for on-the-go access to data, no-code BI solutions are designed with mobile accessibility in mind. This allows users to access dashboards, receive alerts, and make data-driven decisions from anywhere, ensuring that mobility is not a barrier to insight.
Embedded Analytics: Some no-code BI platforms offer embedded analytics capabilities, allowing organizations to integrate BI tools and dashboards directly into their existing business applications. This integration means users can access and interact with data insights within the applications they use daily, significantly reducing the friction in transitioning between analysis and action.
When no-code Business Intelligence platforms offer embedded analytics capabilities, they combine the best of both worlds: they remove the need for coding skills in analytics(no-code data analytics) and ensure that powerful BI tools can be directly accessed within the business applications users operate daily. This dual advantage significantly enhances operational efficiency and decision-making processes, making it easier for organizations to adopt a data-driven culture.
Customizable Data Stories: To make insights even more accessible, no-code BI platforms enable the creation of data stories—narrative reports that combine data visualizations with explanatory text. These stories can be customized for different audiences, ensuring that insights are presented in a context that is most relevant and easily understood by each stakeholder.
Conclusion
So, if you thought BI was just for analysts, it's time to think again. With Grow, you can embrace the future of business intelligence. Sign up for your 14-day free trial today and join the growing number of businesses that are leveraging our no-code BI solution to unlock their full potential.
Explore Grow Reviews 2024 to hear real stories of transformation and see how your business could be next. Don't miss out on this opportunity to turn data into your most powerful asset.